## [1] "Last Updated: Sunday, 08 Jun, 2025 10:30"Ghibliometer

|

|
Probability of Winning an Election
This is the probability of each party winning an election at this point in time, given their current polling, and what we’ve seen historically.
Put another way, if we were to randomly visualize 100 out of those simulated draws, it would look something like this:
Estimated Election Day Result
Here is how the vote share on election day is expected to pan out. The line value is the median vote observed in the 40,000 simulations, and the lighter shaded bars to each side are the 80% and 90% credible intervals respectively: 80% and 90% of all simulations run fell within this range. This visualization is intended to give a better look at the probability of a range of outcomes on election day.
Election Outcomes
To arrive at these probabilities, public polls were collected from MaltaToday, Esprimi/Lobeslab, Sagalytics, and MISCO. A smoothing line based on a GAM spline was fit.
Historical absolute error (the difference between the polls to the actual election results in 2017 and 2013) was then calculated.
The election was then simulated 40,000 times, with each iteration having a random injection of both poll absolute error and the variability of the polls (measured through the spline’s error). For most cases, it was what was around what was historically expected, but in some cases, larger errors, such as one would see with major polling misses were also simulated.
The vertical lines are each respective party’s polling average on the latest day.
How has this probability evolved over time?
This probability has changed in the following manner since the last General Election on March 26th 2022:
Poll aggregate
This is an aggregate of all recent relevant polling. It is one of the main inputs into the model, but is also relatively informative stand alone.
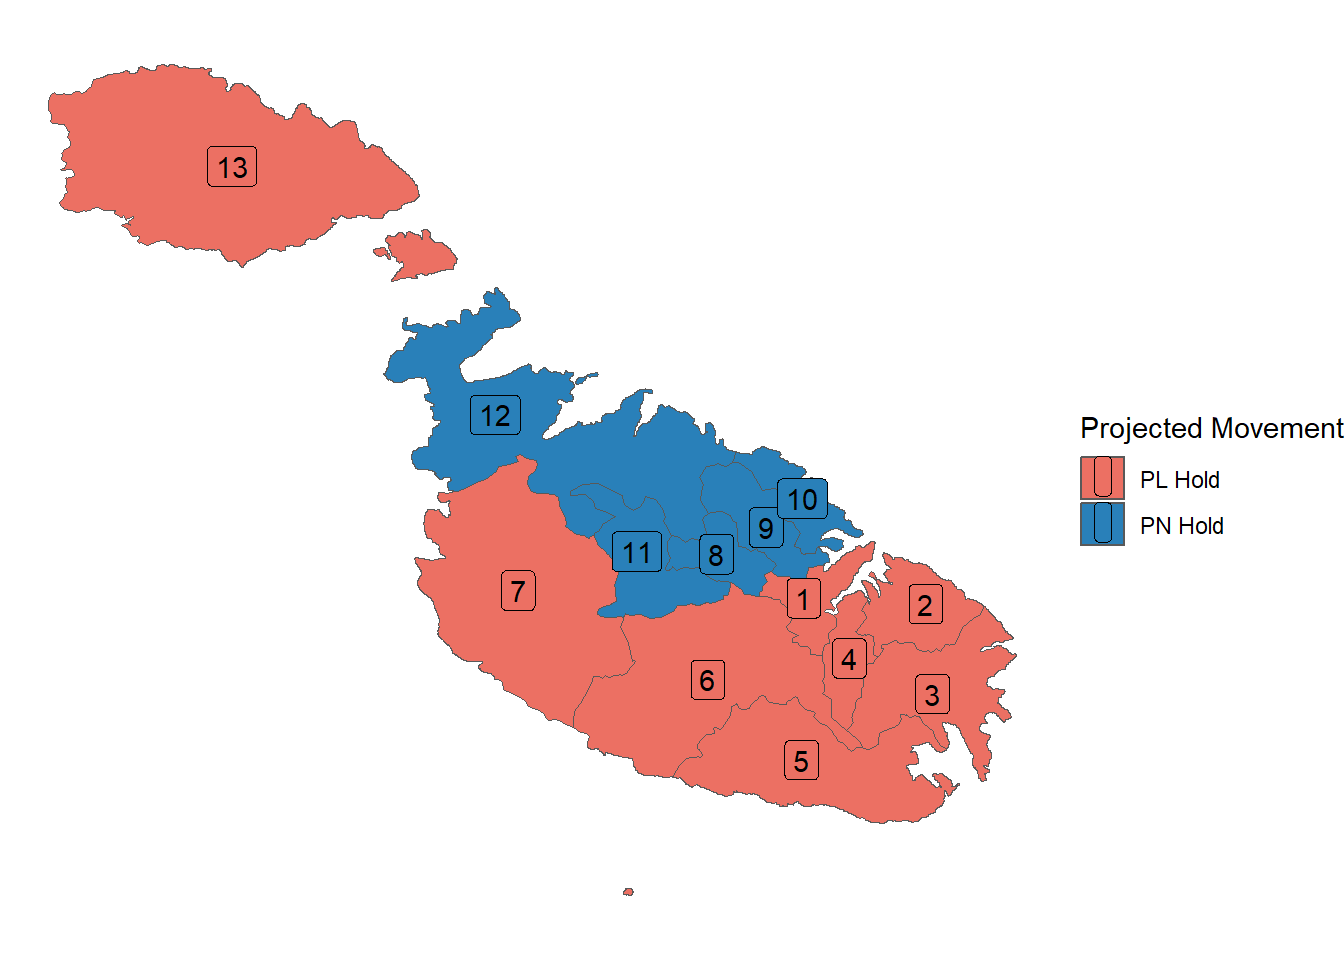
Projected District Swings
Given what we know about these districts historically, and the observed national level trends, here’s how the situation at a district level is expected to pan out.
This is the most experimental feature on this page and is the most likely to change going forward.
Pollster Ratings
And here’s the track record of the pollsters whose polls we use as the primary input to this model. In general, performance tended to be good across the board for the past 3 election cycles, although this might deteriorate in the future if the parties get closer. This is because all else being equal, it’s easier to detect a 60/40 split in the electorate reliably than a 50/50 one.
## # A tibble: 5 × 3
##   Pollster            `# of Polls` `Average Error`
##   <chr>                      <dbl> <chr>
## 1 Generic/Unspecified           15 2.86%
## 2 MT                            25 1.65%
## 3 Misco                          1 1.54%
## 4 Esprimi                        4 1.2%
## 5 Sagalytics                     9 0.78%
Any suggestions/comments are welcome! Click the “email me” icon below.