Intro
Our electoral system has been facing a relentless slow drip of criticism percolating through the years (1, 2, 3) in an attempt to suggest that it is lackluster and needs updating. The arguments against STV5 in its current form, when reduced to their gist, are, that it props up the current two party system and that districts are more trouble than they’re worth.
These criticisms are devoid of historical awareness when Malta had no issue electing multiple parties using the current system, and global awareness, where Ireland has no issue electing non-party affiliated independents to the Dáil Éireann. But perhaps most tellingly, when pressed for an alternative system, critics rarely muster one.
The real danger of not fighting back against these arguments is finding yourself reading more and more the same statements repeated at face value.
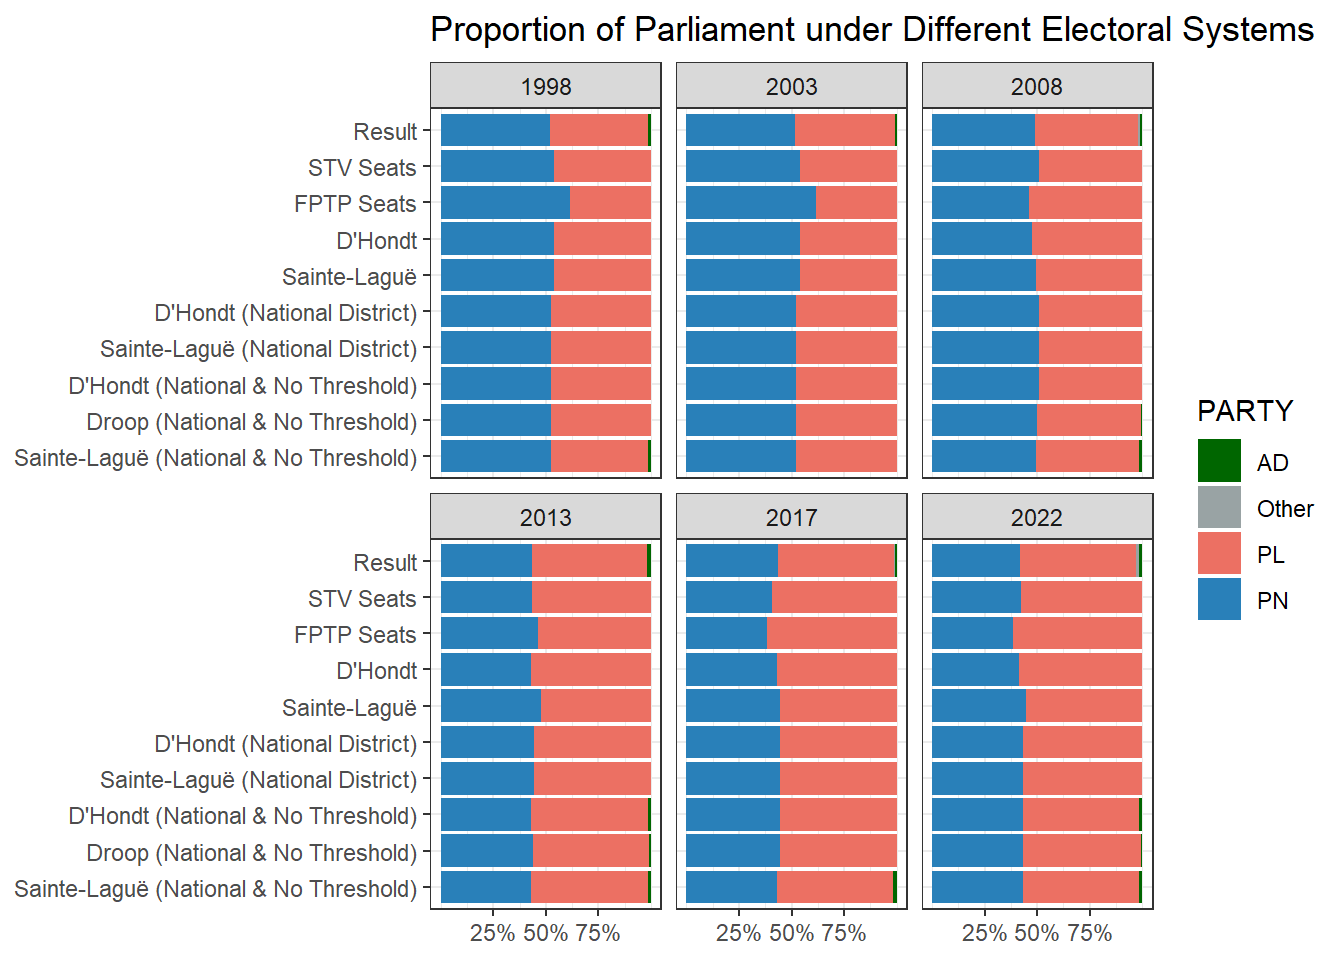
To assess the merit of these arguments, this post will first look at what electoral outcomes in the past would have of looked like using electoral data and different electoral systems currently employed in the world. After all, if the issue is the electoral system, outcomes would have of been radically different under some other system, right?
Secondly, we will briefly touch on some of the wonderful features of STV we’ll lose, before finally covering a contemporary and local example of a third party doing well in STV5.
Data
We’ll be using electoral data from 1996-2022, largely from the Malta Elections resource but also supplemented by Electoral Comission data for the last couple of elections.
As a small note, I’ve included snippets of code to remain honest: if it’s not your thing, don’t get discouraged, there will be plenty of graphs and words to tell this story.
The Different Methods
Allocating seats on the basis of votes is a problem as old as democracy itself: two of the earliest men to grapple with the problem were Founding Fathers of the United States: Alexander Hamilton and Thomas Jefferson. There have been several different ways proposed to fairly translate the choice of the people into the fairest and best representation it can be, but no system is a silver bullet. Instead, we should think of them as making different compromises. We’ll go through them roughly chronologically in the order they were invented, and see how the composition of Parliament would vary, with the minor caveat of ignoring completely the gender correction mechanism currently employed.
First Past the post
Although no one serious is realistically proposing we go to first past the post, it is a good warming up exercise. Alternate FPTP Malta still has 13 electoral districts with 5 seats. The party with the most votes in that district wins all 5 seats. The US and UK are two very famous FPTP examples.
fptp <- recent_elections %>%
  group_by(YEAR, Dist, PARTY, SEATS) %>%
  summarise(first_vote = sum(CT1, na.rm=T)) %>%
  group_by(YEAR, Dist, SEATS) %>%
  slice(which.max(first_vote)) %>%
  ungroup()


fptp %>%
  group_by(YEAR, PARTY) %>%
  summarise(seat=sum(SEATS, na.rm=T)) %>%
  ggplot(aes(x=YEAR, seat, color=PARTY, label=seat))+
  geom_line()+
  geom_point()+
  geom_label()+
  theme_bw()+
  xlab('Year')+
  ylab('Seats')+
  labs(title='Maltese Parliaments under FPTP')+
  malta_politics_scale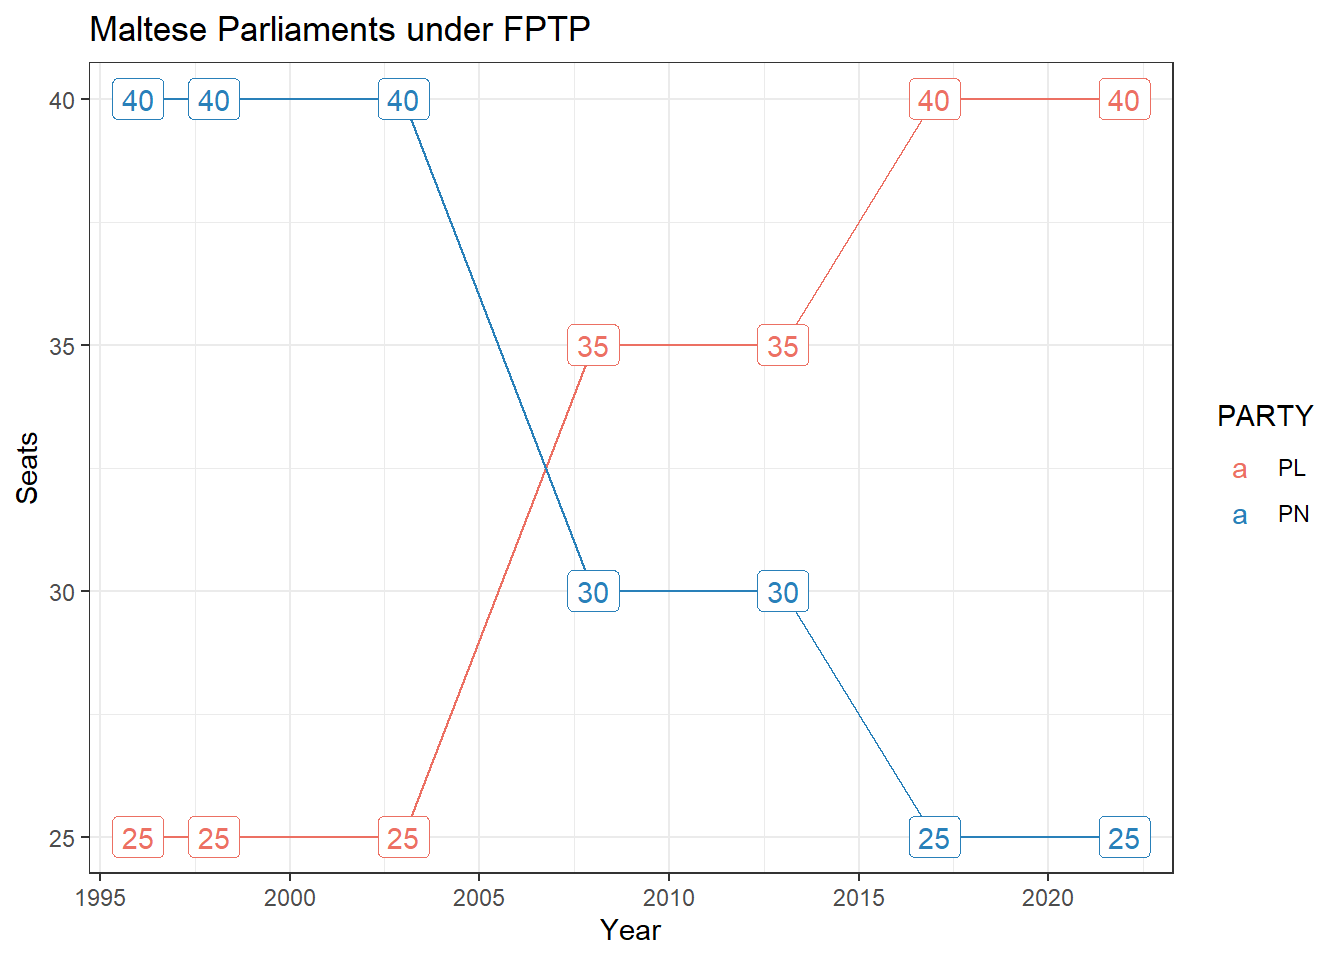
The winner takes all district rules means we end up with nice round numbers and exaggerated differences.
Proportional Representation with D’Hondt
The D’Hondt formula (also discovered independently by Jefferson a century earlier) is probably the most widely used proportional representation method. This 3 minute video is probably the best explainer on it.
Again, we’ll maintain the electoral districts in their current form. Some countries that use D’Hondt with districts in this way are Spain, Belgium, and part of the madness that is the Italian electoral system.
dhondt <- recent_elections %>%
  group_by(YEAR, Dist, PARTY, SEATS) %>%
  summarise(first_vote = sum(CT1, na.rm=T)) %>%
  group_by(YEAR, Dist) %>%
  summarise(electoral::seats(PARTY, first_vote, 5, 'dhondt')) %>%
  mutate(method = 'dhondt')

dhondt %>%
  group_by(YEAR, PARTY) %>%
  summarise(seat=sum(SEATS, na.rm=T)) %>%
  filter(seat >0) %>%
  ggplot(aes(x=YEAR, seat, color=PARTY, label=seat))+
  geom_line()+
  geom_point()+
  geom_label()+
  theme_bw()+
  xlab('Year')+
  ylab('Seats')+
  labs(title="Maltese Parliaments under D'Hondt")+
  malta_politics_scale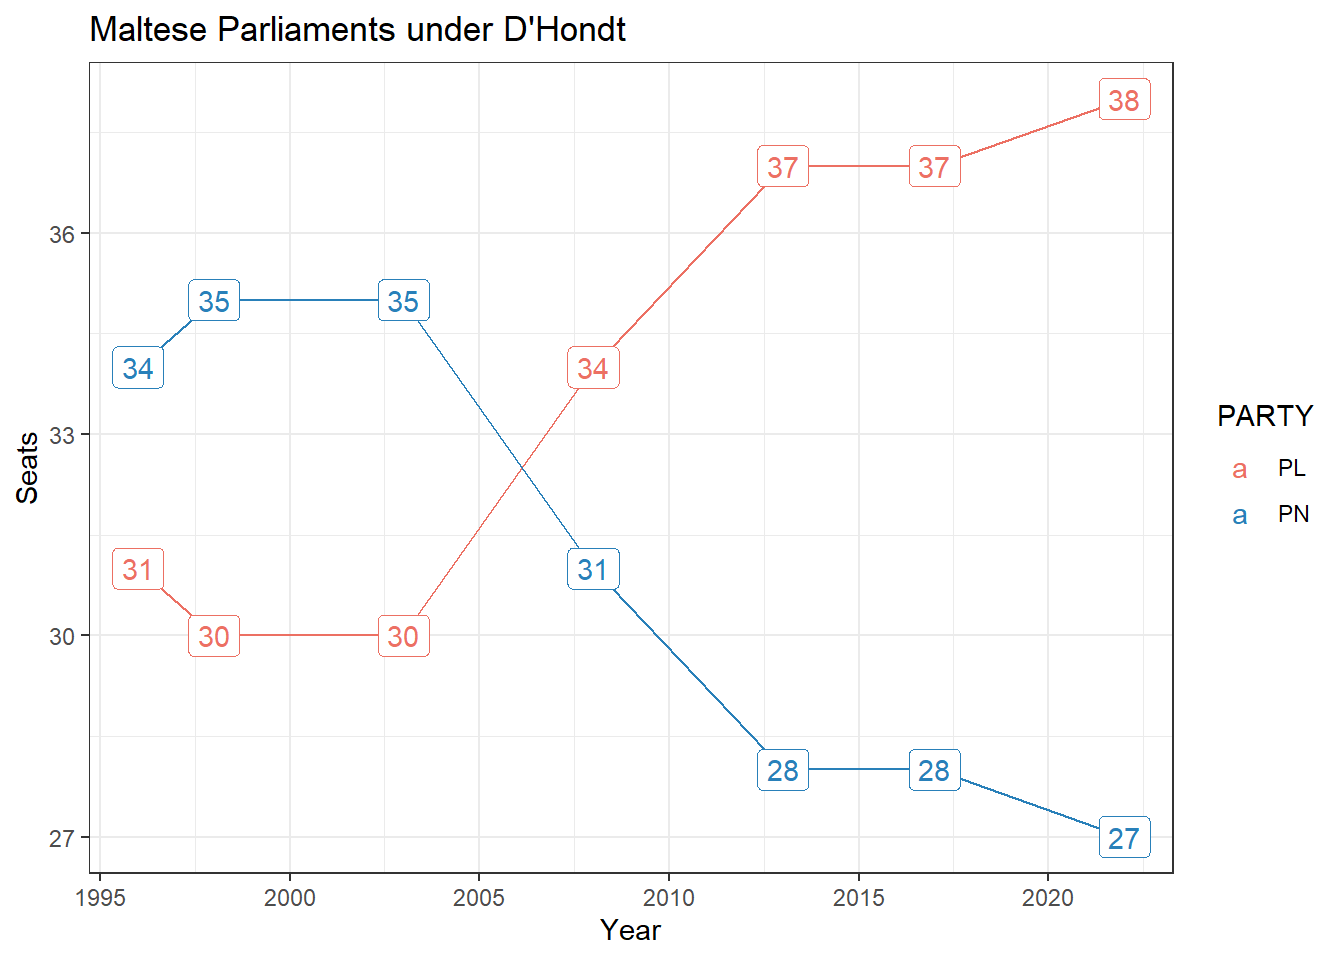
One of the principal criticisms of D’Hondt is that it disfavors smaller parties. This isn’t necessarily a bad thing, you want to keep political fragmentation down, which is why many countries still use it. But an alternative that’s fairer to smaller parties is the Sainte-Laguë method. We’ll try that next.
Sainte-Laguë method
The main difference of the Sainte-Laguë method is that the votes are divided by twice the number of seats + 1, instead of the number of seats + 1 as in D’Hondt. The keen eyed among you might have of noticed that in the code chunk the method is named ‘webster’ in electoral ’s seats function, because just like Jefferson/D’Hondt, it was invented independently twice on either side of the Atlantic, first by Daniel Webster in New England and nearly a century later by André Sainte-Laguë in France.
 mod_saint_lague <- recent_elections %>%
  group_by(YEAR, Dist, PARTY, SEATS) %>%
  summarise(first_vote = sum(CT1, na.rm=T)) %>%
  group_by(YEAR, Dist) %>%
  summarise(electoral::seats(PARTY, first_vote, 5,  "webster")) %>%
  mutate(method =  "saint-lague")

 mod_saint_lague%>%
  group_by(YEAR, PARTY) %>%
  summarise(seat=sum(SEATS, na.rm=T)) %>%
  filter(seat >0) %>%
  ggplot(aes(x=YEAR, seat, color=PARTY, label=seat))+
  geom_line()+
  geom_point()+
  geom_label()+
  theme_bw()+
  xlab('Year')+
  ylab('Seats')+
  labs(title="Maltese Parliaments under Sainte-Laguë")+
  malta_politics_scale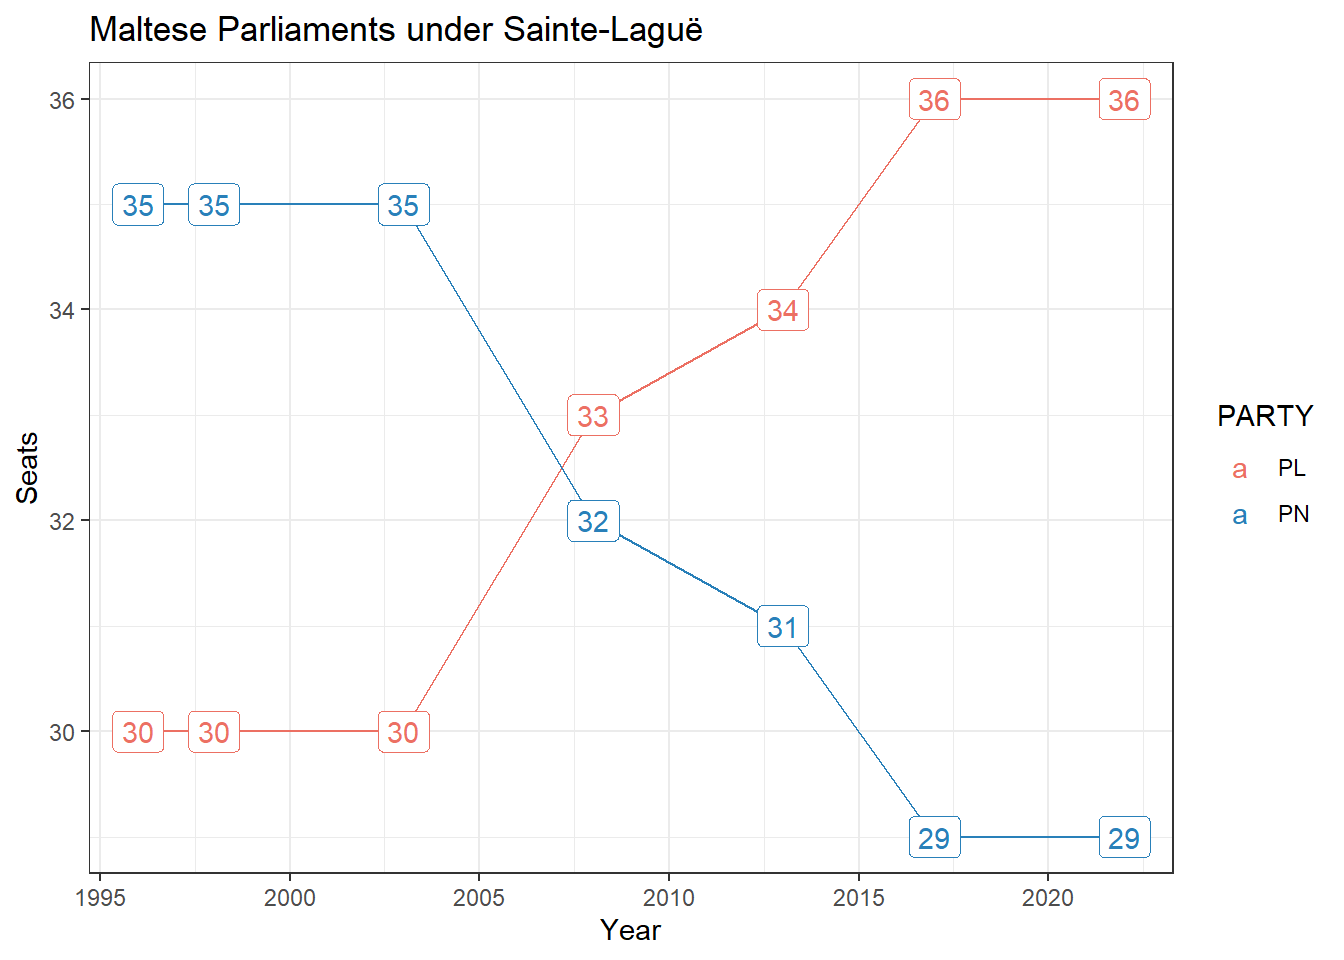
Mixed Member Proportional
The other major family employed in places like Germany and New Zealand is Mixed Member Proportional. Here a voter votes for a representative in his district, and a party at the national level, with additional top up seats used to ensure a parliament proportional to the national vote.
We can also jerryrig an indicatory MMP, since it’s really two methods we’ve done before. The first part is selecting FPTP representatives. The second part is calculating seats using one of the proportional methods above. In MMP Malta let’s keep the 13 electoral regions. Each region votes for 3 representatives, with 26 party seats to balance nationally. This is roughly the 60/40 split New Zealand has.
First, per region, we elect our representatives. For illustration purposes, in district 1 in 1996, this would have looked like:
region_reps <- recent_elections %>%
  select(YEAR, NAME, CT1, Dist, PARTY) %>%
  group_by(YEAR, Dist) %>%
  top_n(3, CT1) %>%
  ungroup()

region_reps %>%
  filter(Dist==1 & YEAR ==1996)
## # A tibble: 3 × 5
## YEAR NAME CT1 Dist PARTY
## <dbl> <chr> <dbl> <dbl> <chr>
## 1 1996 Sant, Alfred 9129 1 PL
## 2 1996 De Marco, Guido 2975 1 PN
## 3 1996 Mifsud Bonnici, Antoine 2139 1 PNThen we’ll run a national Sainte-Laguë using a threshold of 3%. Some of you might raise an eyebrow at this point, but electoral thresholds are present in the majority of systems and 3% is fairly low as they go. Also, we will look into what happens if we drop this later.
threshold=0.03

party_list_votes <- recent_elections %>%
  group_by(YEAR, PARTY, SEATS) %>%
  summarise(first_vote = sum(CT1, na.rm=T)) %>%
  group_by(YEAR) %>%
  mutate(prop = first_vote/sum(first_vote)) %>%
  filter(prop >= threshold) %>%
  summarise(electoral::seats(PARTY, first_vote, 65,  "webster")) %>%
  mutate(method =  "national-saint-lague")
Then, by subtracting the already assigned seats from the proportional ones, we get the top up values:
region_reps %>%
  group_by(YEAR, PARTY) %>%
  tally() %>%
  full_join(party_list_votes) %>%
  filter(SEATS >0) %>%
  mutate(n = if_else(is.na(n), 0, n),
         topup_seats = SEATS-n) %>%
  rename(elected_seats = n) %>%
  select(SEATS, YEAR, PARTY, elected_seats, topup_seats) %>%
  pivot_longer(cols = c(elected_seats, topup_seats),
               names_to = "Seat_Type",
               values_to = "Seats") %>%
  mutate(SEATS = if_else(Seat_Type =='topup_seats', NA, SEATS)) %>%  #just to make viz prettier
  ggplot(aes(x = factor(YEAR), y = Seats, fill = Seat_Type, label=SEATS)) +
  geom_bar(stat = "identity", position = "stack")+
  geom_label(nudge_y=10, fill='white')+
  facet_wrap(~PARTY, ncol=1)+
  theme_bw()+
  scale_fill_manual(values = c("topup_seats" = "cadetblue", "elected_seats" = "aquamarine3"))+
  xlab(NULL)+
  labs(title='Seats Allocated under MMP')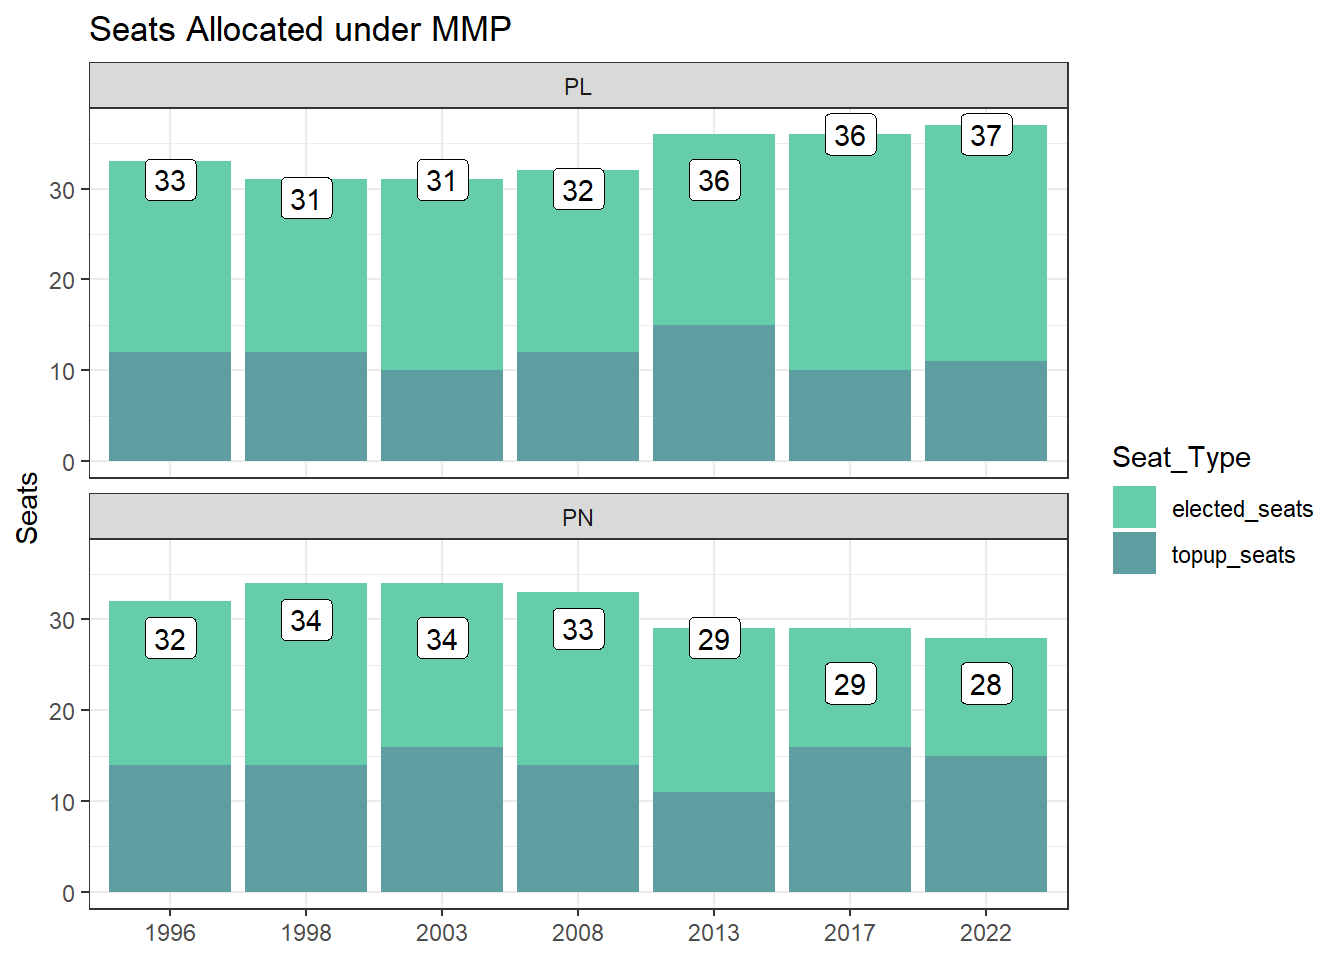
Collapsing the districts and moving to one nationwide constituency
This is a horrible idea that deprives people of local representation, but let’s entertain it. We’ll also use a 3% threshold at the national level. I won’t repeat it for the Sainte-Laguë apportionment method since it will be identical to MMP above, but we’ll try it for two others.
National Level D’Hondt: 1 District
The first is D’Hondt. To simulate party vote, we’ll just group by party and sum the first count votes nationally (this is analogous to the headline result reported on counting day).
threshold=0.03

dhondt_national <- recent_elections %>%
  group_by(YEAR, PARTY, SEATS) %>%
  summarise(first_vote = sum(CT1, na.rm=T)) %>%
  group_by(YEAR) %>%
  mutate(prop = first_vote/sum(first_vote)) %>%
  filter(prop >= threshold) %>%
  summarise(electoral::seats(PARTY, first_vote, 65, 'dhondt')) %>%
  mutate(method = 'dhondt_national')

dhondt_national %>%
  group_by(YEAR, PARTY) %>%
  summarise(seat=sum(SEATS, na.rm=T)) %>%
  filter(seat >0) %>%
  ggplot(aes(x=YEAR, seat, color=PARTY, label=seat))+
  geom_line()+
  geom_point()+
  geom_label()+
  theme_bw()+
  xlab('Year')+
  ylab('Seats')+
  labs(title="Maltese Parliaments under National Level D'Hondt")+
  malta_politics_scale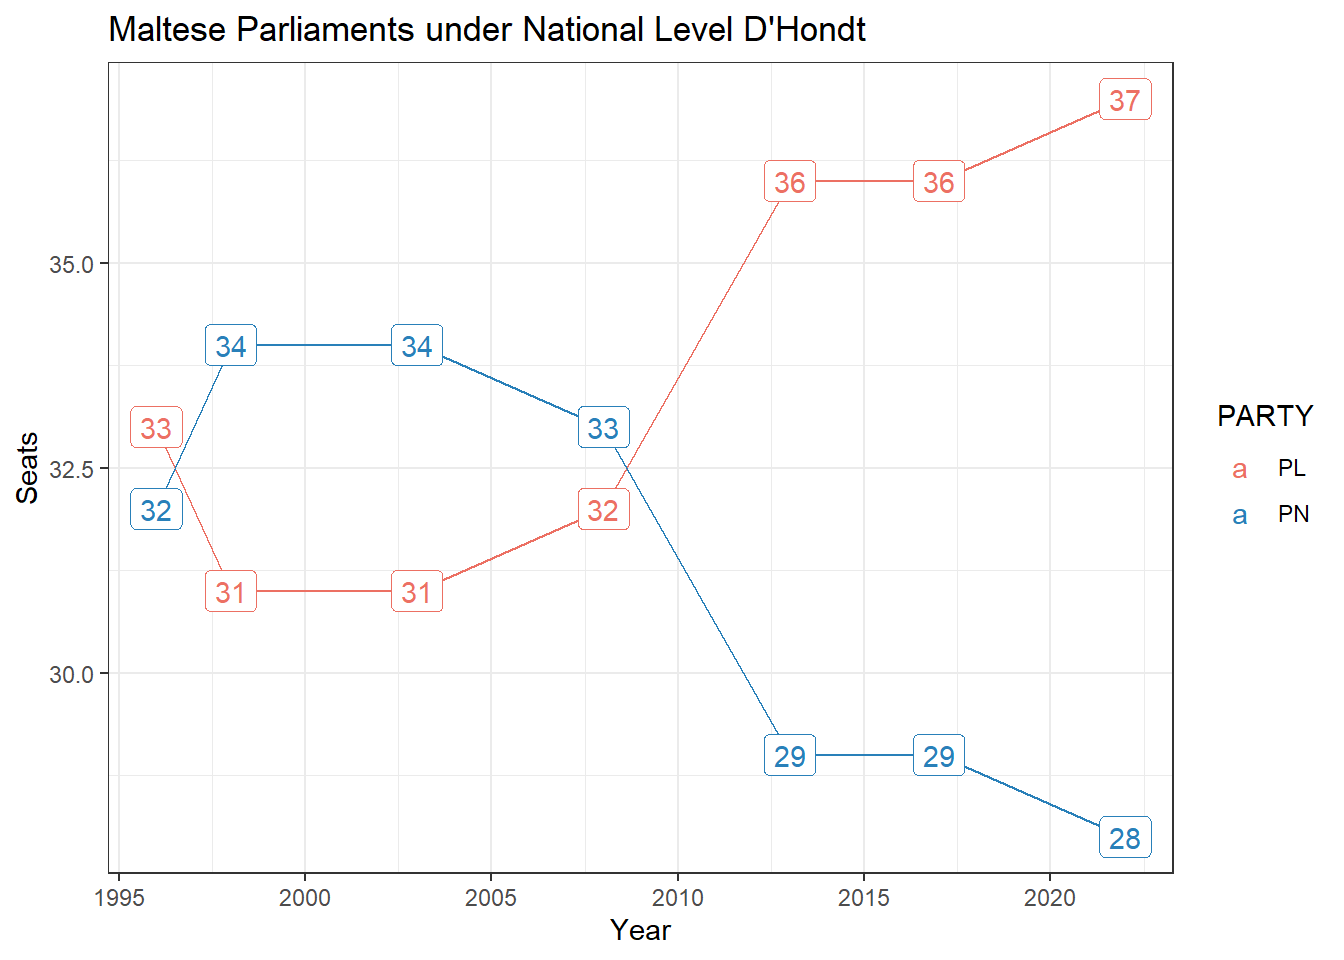
Droop
There is one other broad family of allocating seats, the highest remainder. The result is identical to the one above.
threshold=0.03

droop_national <- recent_elections %>%
  group_by(YEAR, PARTY, SEATS) %>%
  summarise(first_vote = sum(CT1, na.rm=T)) %>%
  group_by(YEAR) %>%
  mutate(prop = first_vote/sum(first_vote)) %>%
  filter(prop >= threshold) %>%
  summarise(electoral::seats(PARTY, first_vote, 65, 'droop')) %>%
  mutate(method = 'droop_national_no_threshold')

droop_national %>%
  group_by(YEAR, PARTY) %>%
  summarise(seat=sum(SEATS, na.rm=T)) %>%
  filter(seat >0) %>%
  ggplot(aes(x=YEAR, seat, color=PARTY, label=seat))+
  geom_line()+
  geom_point()+
  geom_label()+
  theme_bw()+
  xlab('Year')+
  ylab('Seats')+
  labs(title="Maltese Parliaments under National Level Droop")+
  malta_politics_scale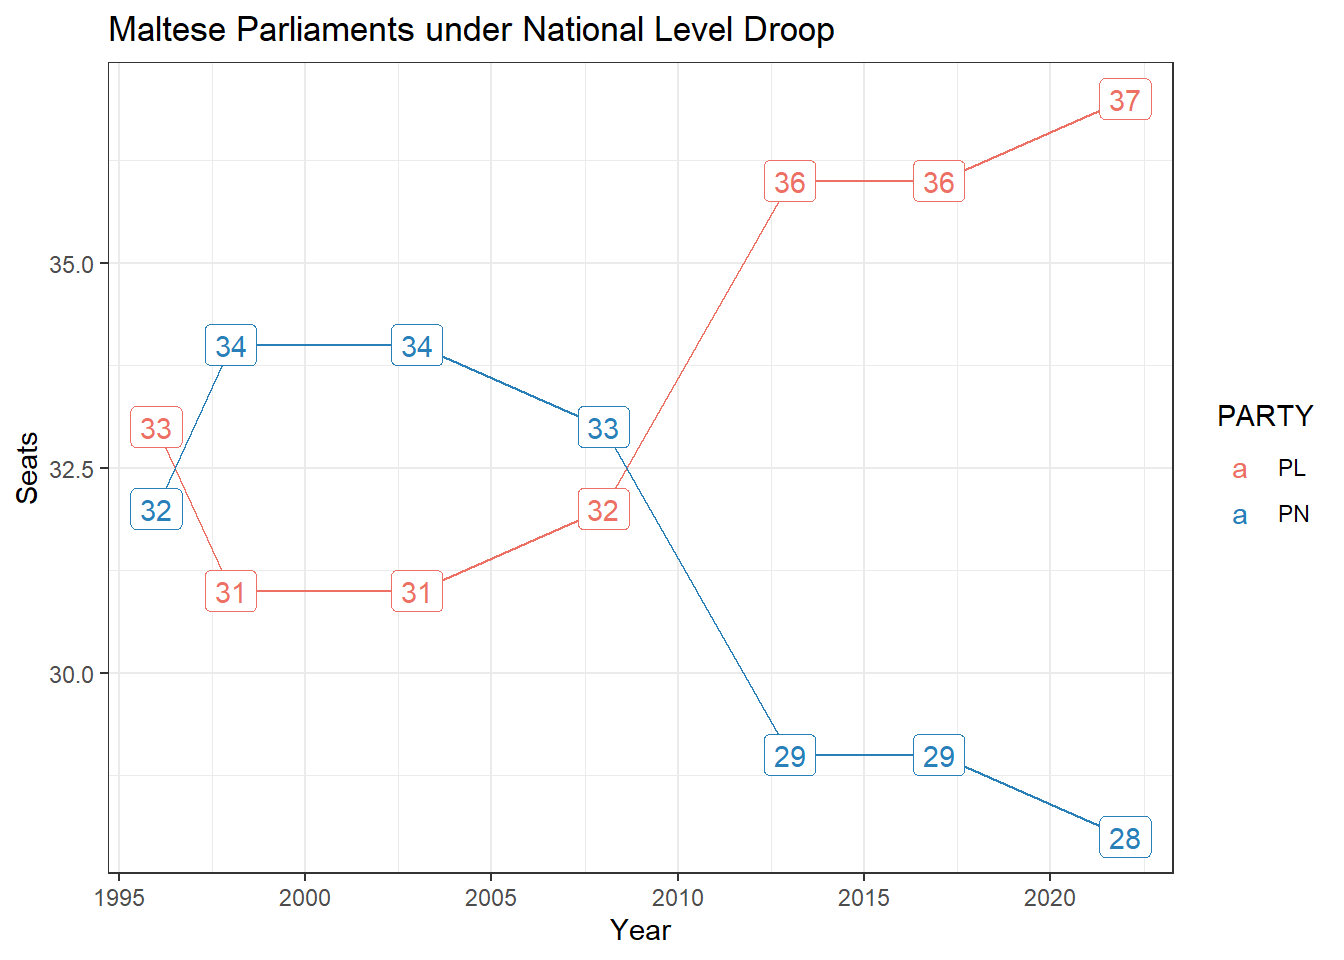
Drop the threshold
The next logical argument would be ‘drop the threshold’, because, if the main problem with STV5 is that they can’t get electors’s favorite minority party elected, and switching over to all of these systems also doesn’t get their minority party elected, then that should be the domino that falls next.
The elephant in the room with this argument is of course very charged people on either side who have no issue torturing the rules for a party like AD to be elected would probably have an issue with Imperium Europa being elected or vice versa.
In any case, let’s entertain this hypothetical.
threshold=0.00

sl__national_no_t <- recent_elections %>%
  group_by(YEAR, PARTY, SEATS) %>%
  summarise(first_vote = sum(CT1, na.rm=T)) %>%
  group_by(YEAR) %>%
  mutate(prop = first_vote/sum(first_vote)) %>%
  filter(prop >= threshold) %>%
  summarise(electoral::seats(PARTY, first_vote, 65, 'webster')) %>%
  mutate(method = 'saint-lague_national_no_threshold')

sl__national_no_t %>%
  group_by(YEAR, PARTY) %>%
  summarise(seat=sum(SEATS, na.rm=T)) %>%
  filter(seat >0) %>%
  ggplot(aes(x=YEAR, seat, color=PARTY, label=seat))+
  geom_line()+
  geom_point()+
  geom_label()+
  theme_bw()+
  xlab('Year')+
  ylab('Seats')+
  labs(title="Maltese Parliaments under National Level Sainte-Laguë with no Threshold")+
  malta_politics_scale
AD would elect a single seat in 1996, 1998, 2008, 2013, 2017 and 2022 under a Sainte-Laguë nationwide closed party list.
Under D’Hondt and Droop, this is slightly less.
threshold=0.00

dh__national_no_t <- recent_elections %>%
  group_by(YEAR, PARTY, SEATS) %>%
  summarise(first_vote = sum(CT1, na.rm=T)) %>%
  group_by(YEAR) %>%
  mutate(prop = first_vote/sum(first_vote)) %>%
  filter(prop >= threshold) %>%
  summarise(electoral::seats(PARTY, first_vote, 65, 'dhondt')) %>%
  mutate(method = 'dhondt_national_no_threshold')

dh__national_no_t %>%
  group_by(YEAR, PARTY) %>%
  summarise(seat=sum(SEATS, na.rm=T)) %>%
  filter(seat >0) %>%
  ggplot(aes(x=YEAR, seat, color=PARTY, label=seat))+
  geom_line()+
  geom_point()+
  geom_label()+
  theme_bw()+
  xlab('Year')+
  ylab('Seats')+
  labs(title="Maltese Parliaments under National Level D'Hondt with no Threshold")+
  malta_politics_scale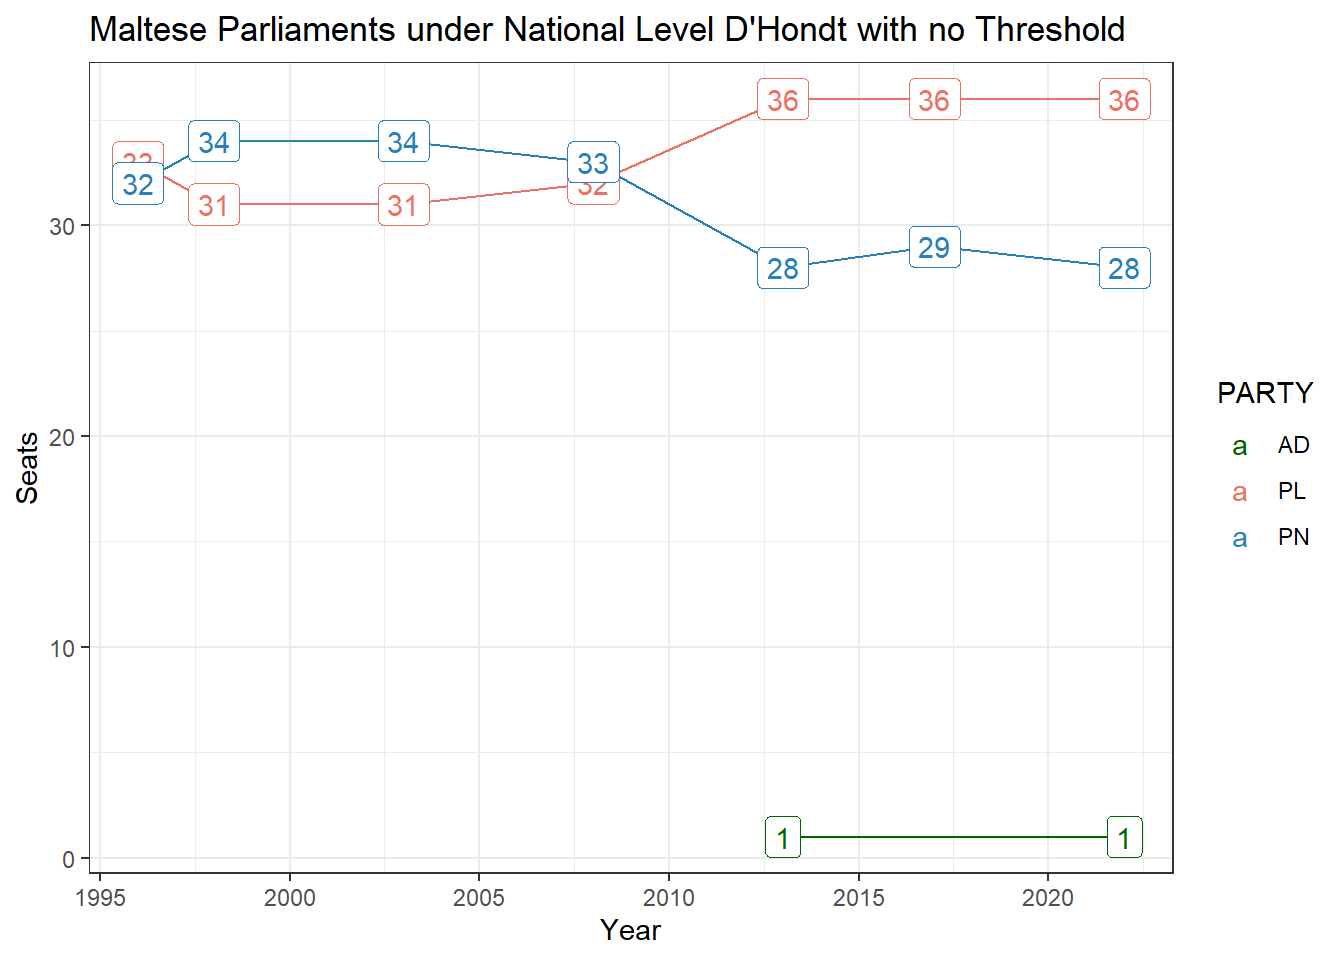
droop__national_no_t <- recent_elections %>%
  group_by(YEAR, PARTY, SEATS) %>%
  summarise(first_vote = sum(CT1, na.rm=T)) %>%
  group_by(YEAR) %>%
  mutate(prop = first_vote/sum(first_vote)) %>%
  filter(prop >= threshold) %>%
  summarise(electoral::seats(PARTY, first_vote, 65, 'droop')) %>%
  mutate(method = 'droop_national_no_threshold')

droop__national_no_t %>%
  group_by(YEAR, PARTY) %>%
  summarise(seat=sum(SEATS, na.rm=T)) %>%
  filter(seat >0) %>%
  ggplot(aes(x=YEAR, seat, color=PARTY, label=seat))+
  geom_line()+
  geom_point()+
  geom_label()+
  theme_bw()+
  xlab('Year')+
  ylab('Seats')+
  labs(title="Maltese Parliaments under National Level Droop with no Threshold")+
  malta_politics_scale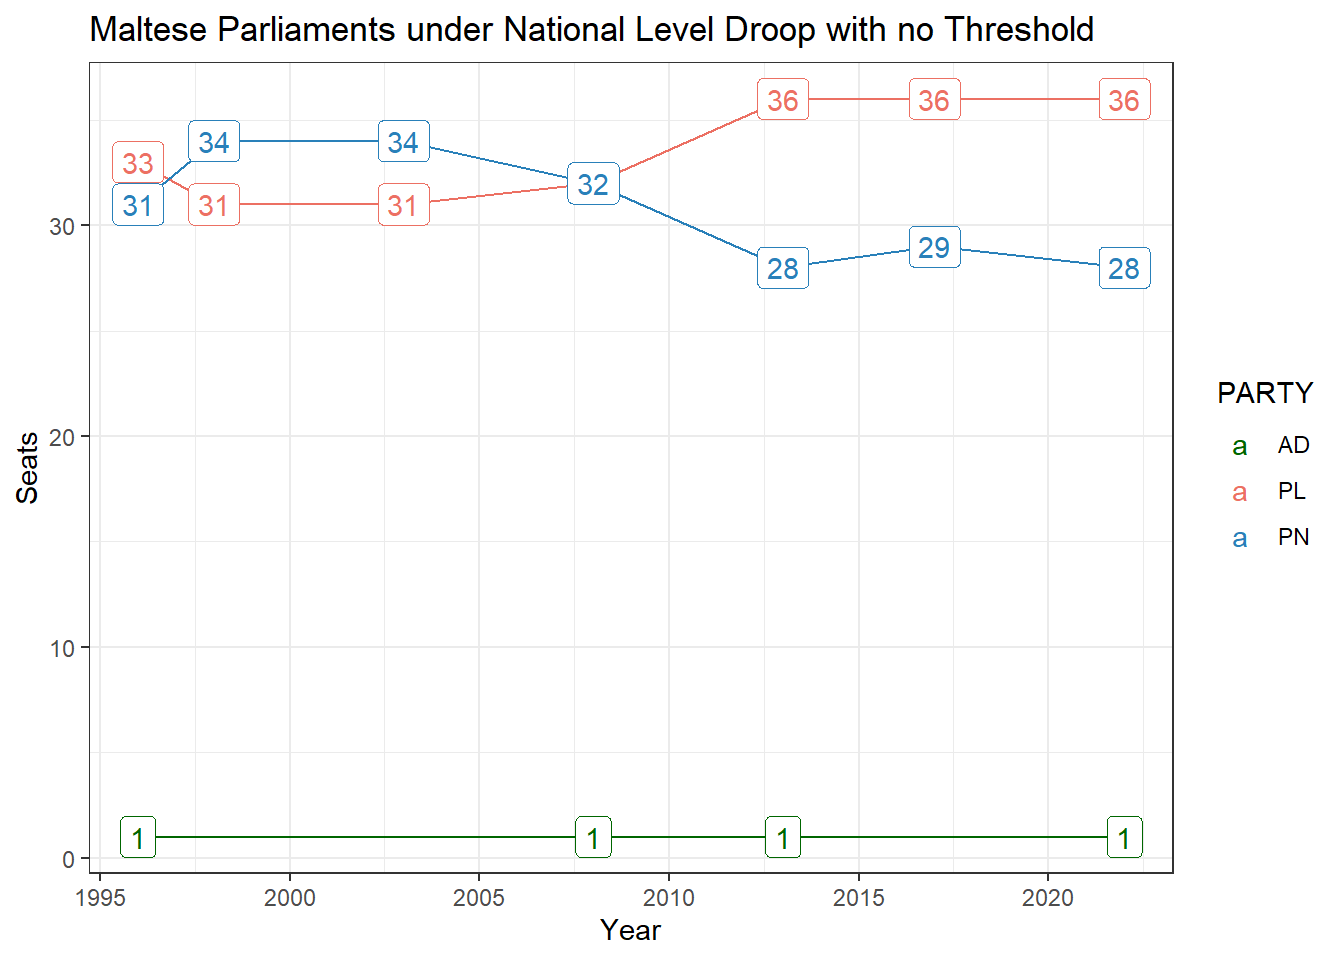
Putting it all together
So finally, if we torture an electoral system to a sufficient degree, we end up with:
Some things that make STV great
Along the way, we’ll lose a vast array of advantages STV has, including the ability to influence who gets elected instead of depending on party lists, or the possibility of contesting the election without a party platform as an independent.
The faculty to indicate preference, while itself incredibly powerful, also leads to higher standards in campaigning, since ‘tactical voting’ becomes redundant. And rather than solidify power, as a number of the other electoral systems investigated do, STV routinely unseats members of the government’s cabinet who have been found lacking by their electors, like Evarist Bartolo in 2022, a situation that would never have of happened to someone of his seniority on a party list system.
Professor Douglas Amy also writes on this negative effect on political machines STV has, explaining how in Cincinnati, a city with one of the worst reputations for corruption, political machines lost power after the transition to STV since independent party candidates were not beholden to high level representatives within the party were elected. The whole 6 page booklet is a fascinating look into the early adoption and subsequent abandonment of STV in the United States. The abandonment part is crucial because since STV effectively makes politics accessible to anyone, it made quick enemies of established parties who did not enjoy relinquishing power. Yet here, the attack on STV is precisely the inverse of this, with outsiders claiming it is the electoral system that hinders them.
There is another touching part in that booklet which I’ll quote verbatim:
STV also encouraged fairer racial and ethnic representation. It produced the first Irish Catholics elected in Ashtabula, and the first Polish Americans elected in Toledo. In Cincinnati, Hamilton and Toledo, African Americans had never been able to win city office until the coming of STV. Significantly, after these cities abandoned PR, African Americans again found it almost impossible to get elected.
And sure enough, as I teased in the intro, if we look hard enough, we’ll manage to find a local contemporary example of a successful third party campaign… so successful in fact that the minority party elected is… PN.
The Gharb local council 2019 election, under STV5 managed this:

This isn’t the sole story of individual candidates making inroads in local council elections, but it is the most contemporary one I can think of, and it just goes to show that third parties not only have a fighting chance, but can best the incumbents, under the current rules if they are popular enough.
And that ‘popular enough’ point is the crux. Under no political system used in most of the world would a party that polls like our third parties expect representation unless it is through some loophole due to ethnic or minority rights. Yet here, we perceive it as some sort of perverse sleight of hand, and advocate throwing the baby out with the bathwater in a vain attempt to ‘fix it’.
Similarly, the argument that eliminating districts will lead to higher standards and less corruption by reducing clientelism is exceptionally naive. If you think random electors are rigging the system, what do you think party insiders behind closed doors will do if handed control over which candidate gets elected on a silver platter?
It’s not particularly surprising that ‘the system’ is at the receiving end of criticism. Frustration with our politics is probably at an all time high, and it is tempting to think that a hard reset is the only reasonable way at change. But rather than being the problem, STV is actually best shot we have at enacting the meaningful change we desire. Instead of trying to relegate it to the past, we should more willingly defend it.
In a 2006 guide written to Scottish candidates on the eve of that country’s upcoming switch to STV for local elections, Lewis Baston wrote: “in STV elections there are no substitutes for having attractive policies, choosing good candidates and running good campaigns. All else is incidental.”
What more could we aspire from an electoral system other than that?
Acknowledgments
Most of the apportionment methods were calculated using Jorge Albuja’s R
electoralpackage.The Malta Elections resource at UoM is probably the most valuable local politics dataset and made writing this post possible.
Serhat Hasancebi’s paper The Maltese single transferable vote experience: a case study of gerrymandering?also simulated outcomes under different methods and was an interesting look at whether there were traces of jerrymandering in 2013 and 2017.
The Electoral Reform Society has a vast library of material on STV, two of which, STV: Aprogressive cause A short history of STV in the US and Campaigning under the single transferable vote were previously linked.
Rein Taagepera’s look at Estonia’s brief dally with STV is fascinating, as is this concept of nationwide representation threshold.