Intro
Elections for the European Parliament will take place in 27 countries from June 6th to 9th. Besides the fact that there are few EP specific polls out there, forecasting this election is more difficult than usual because it is 27 mini elections, each with slightly different rules. There are a few sophisticated models out there that estimate share from historical performance and polling like this one from ECFR. This approach will be simpler. The workflow will be to:
Gather national polling for the 27 member states
Smooth polls and account for country specific error
Estimate a plausible range of outcomes for each country
Transform the percentages above into seats based on that county’s specific rules.
Gathering National Polls
I’ll piggyback on Europe Elects for this bit since they do such a great job of collecting EU polls and have a very user friendly database here.
Using national polling is in itself a simplification since in many countries this isn’t entirely representative of European Parliament performance (generally speaking centrists tend to perform worse than they do nationally, and not every national party contests the EP). But it is the best option we have.
The starting point is the last 2 years of national polling.
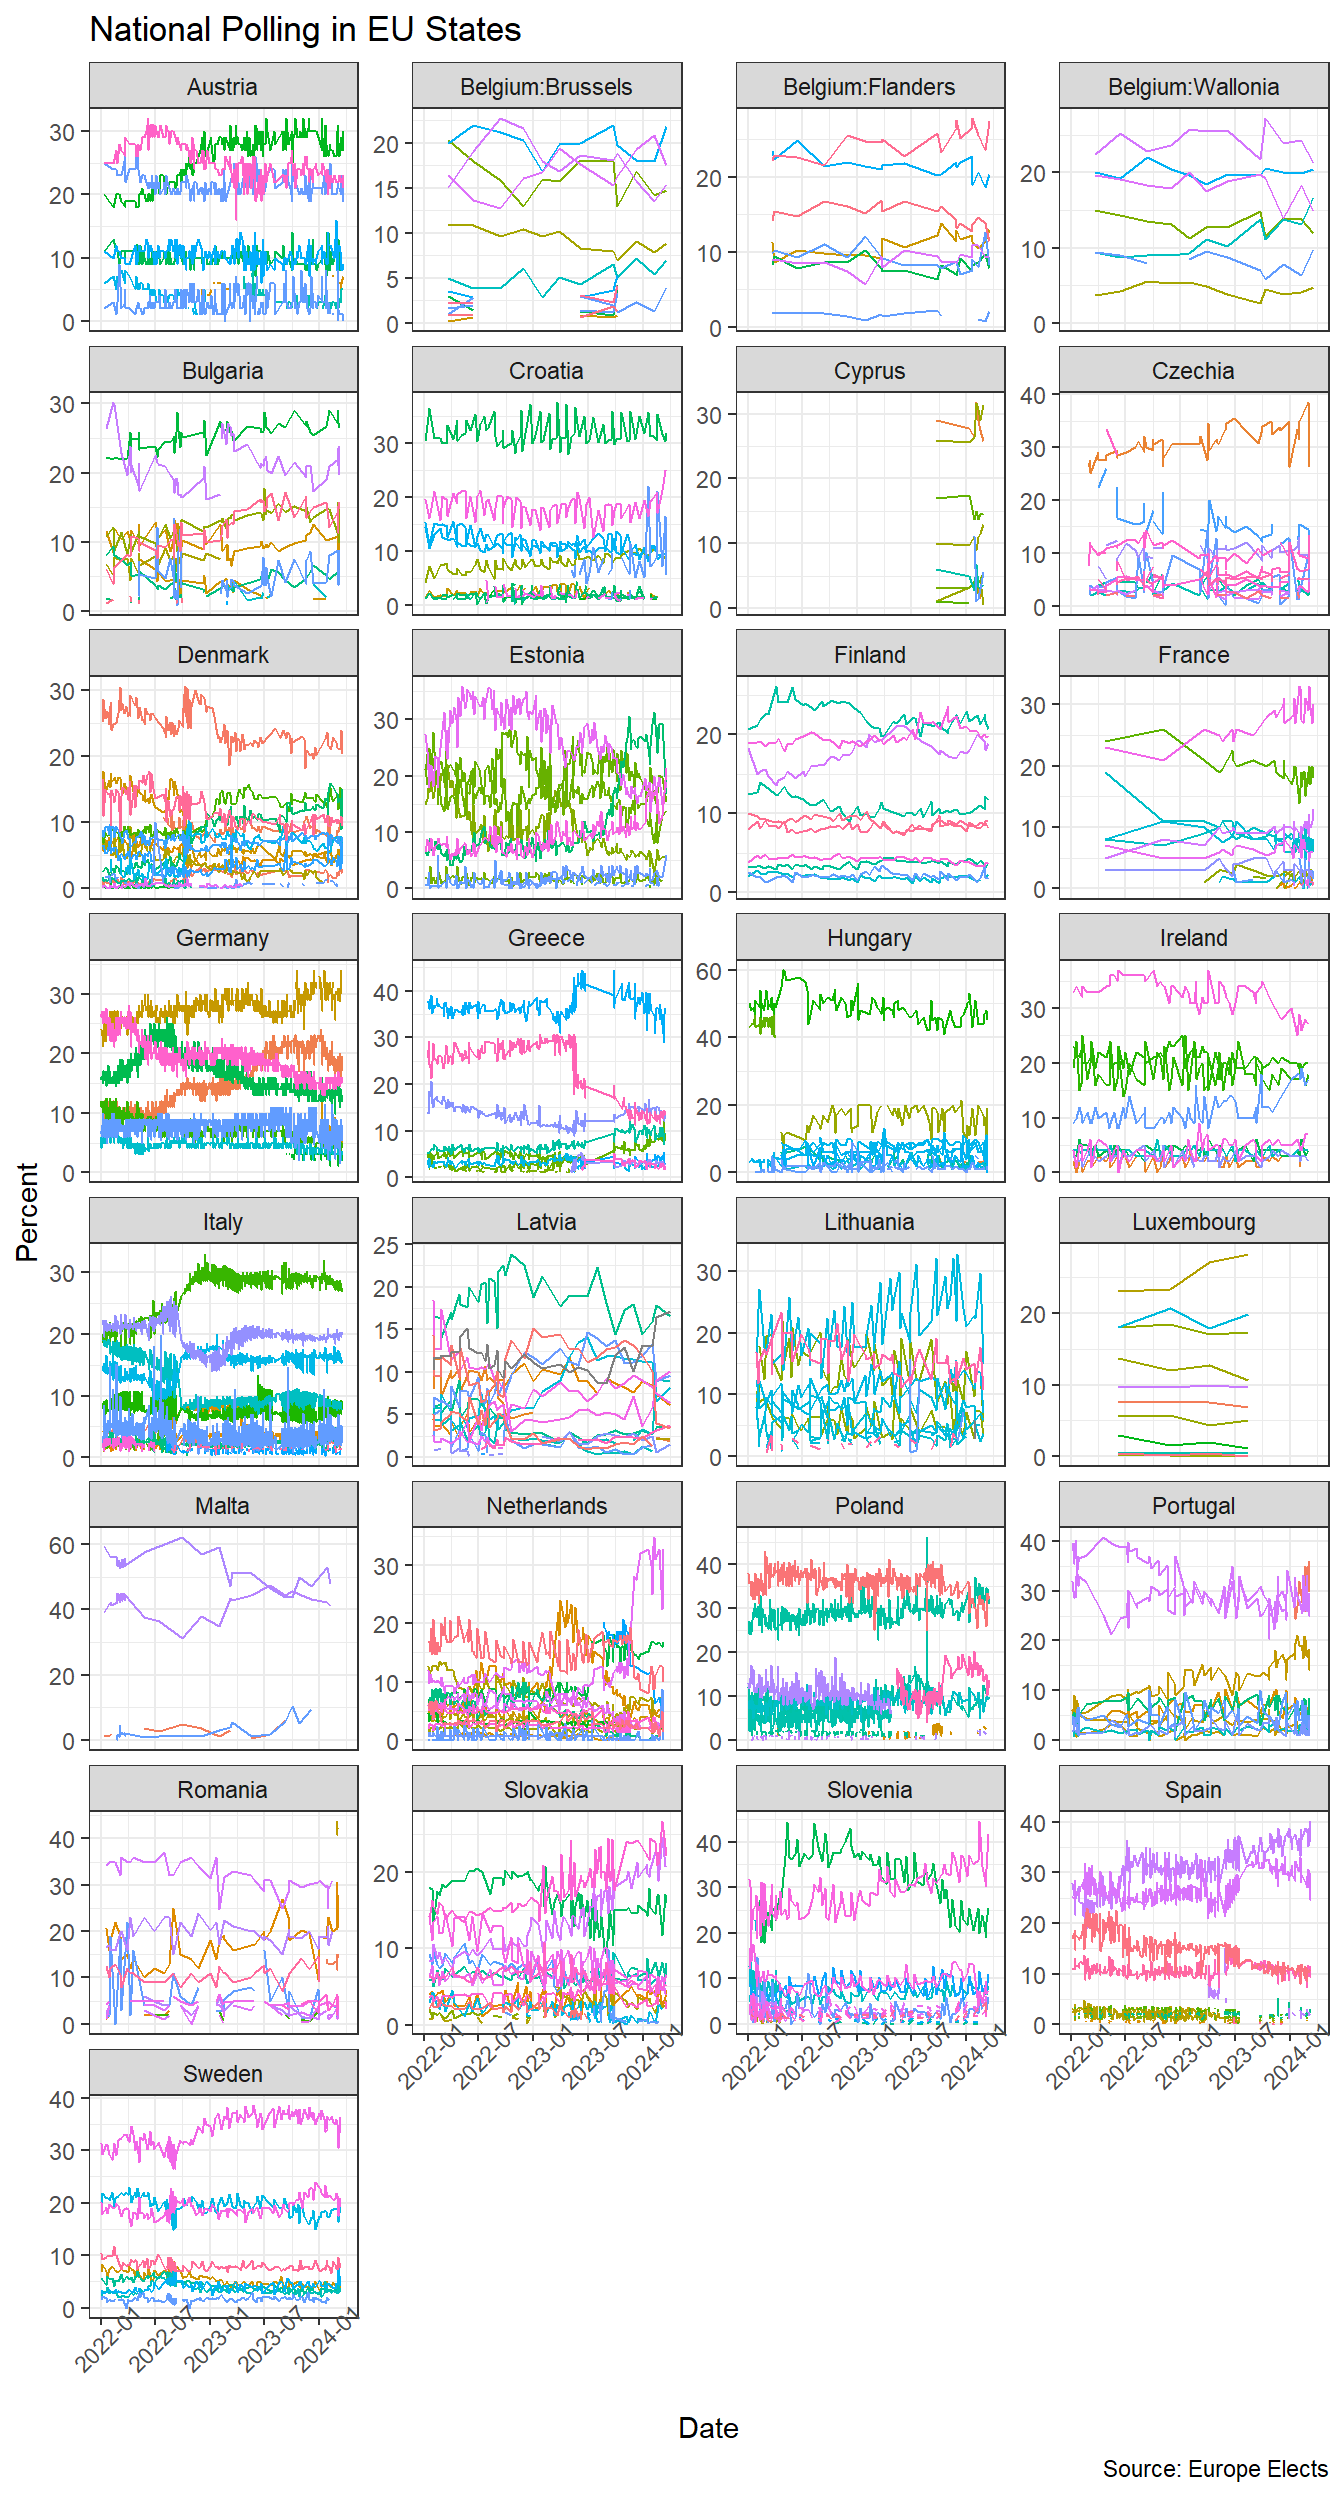
One immediate problem we have is that there is no concept of ‘national’ polling for Belgium: we get polling for the French and Dutch speaking parts separately. This would be ok since they have their own separate constituencies, save for the fact that Brussels is also separate in the data. In theory Brussels voters can chose to vote for either the French or the Dutch electoral colleges, so we’ll have to find a way to blend the Brussels result into these two.
Smoothing the Polls
And here’s what the above looks like with a simple GAM smooth.
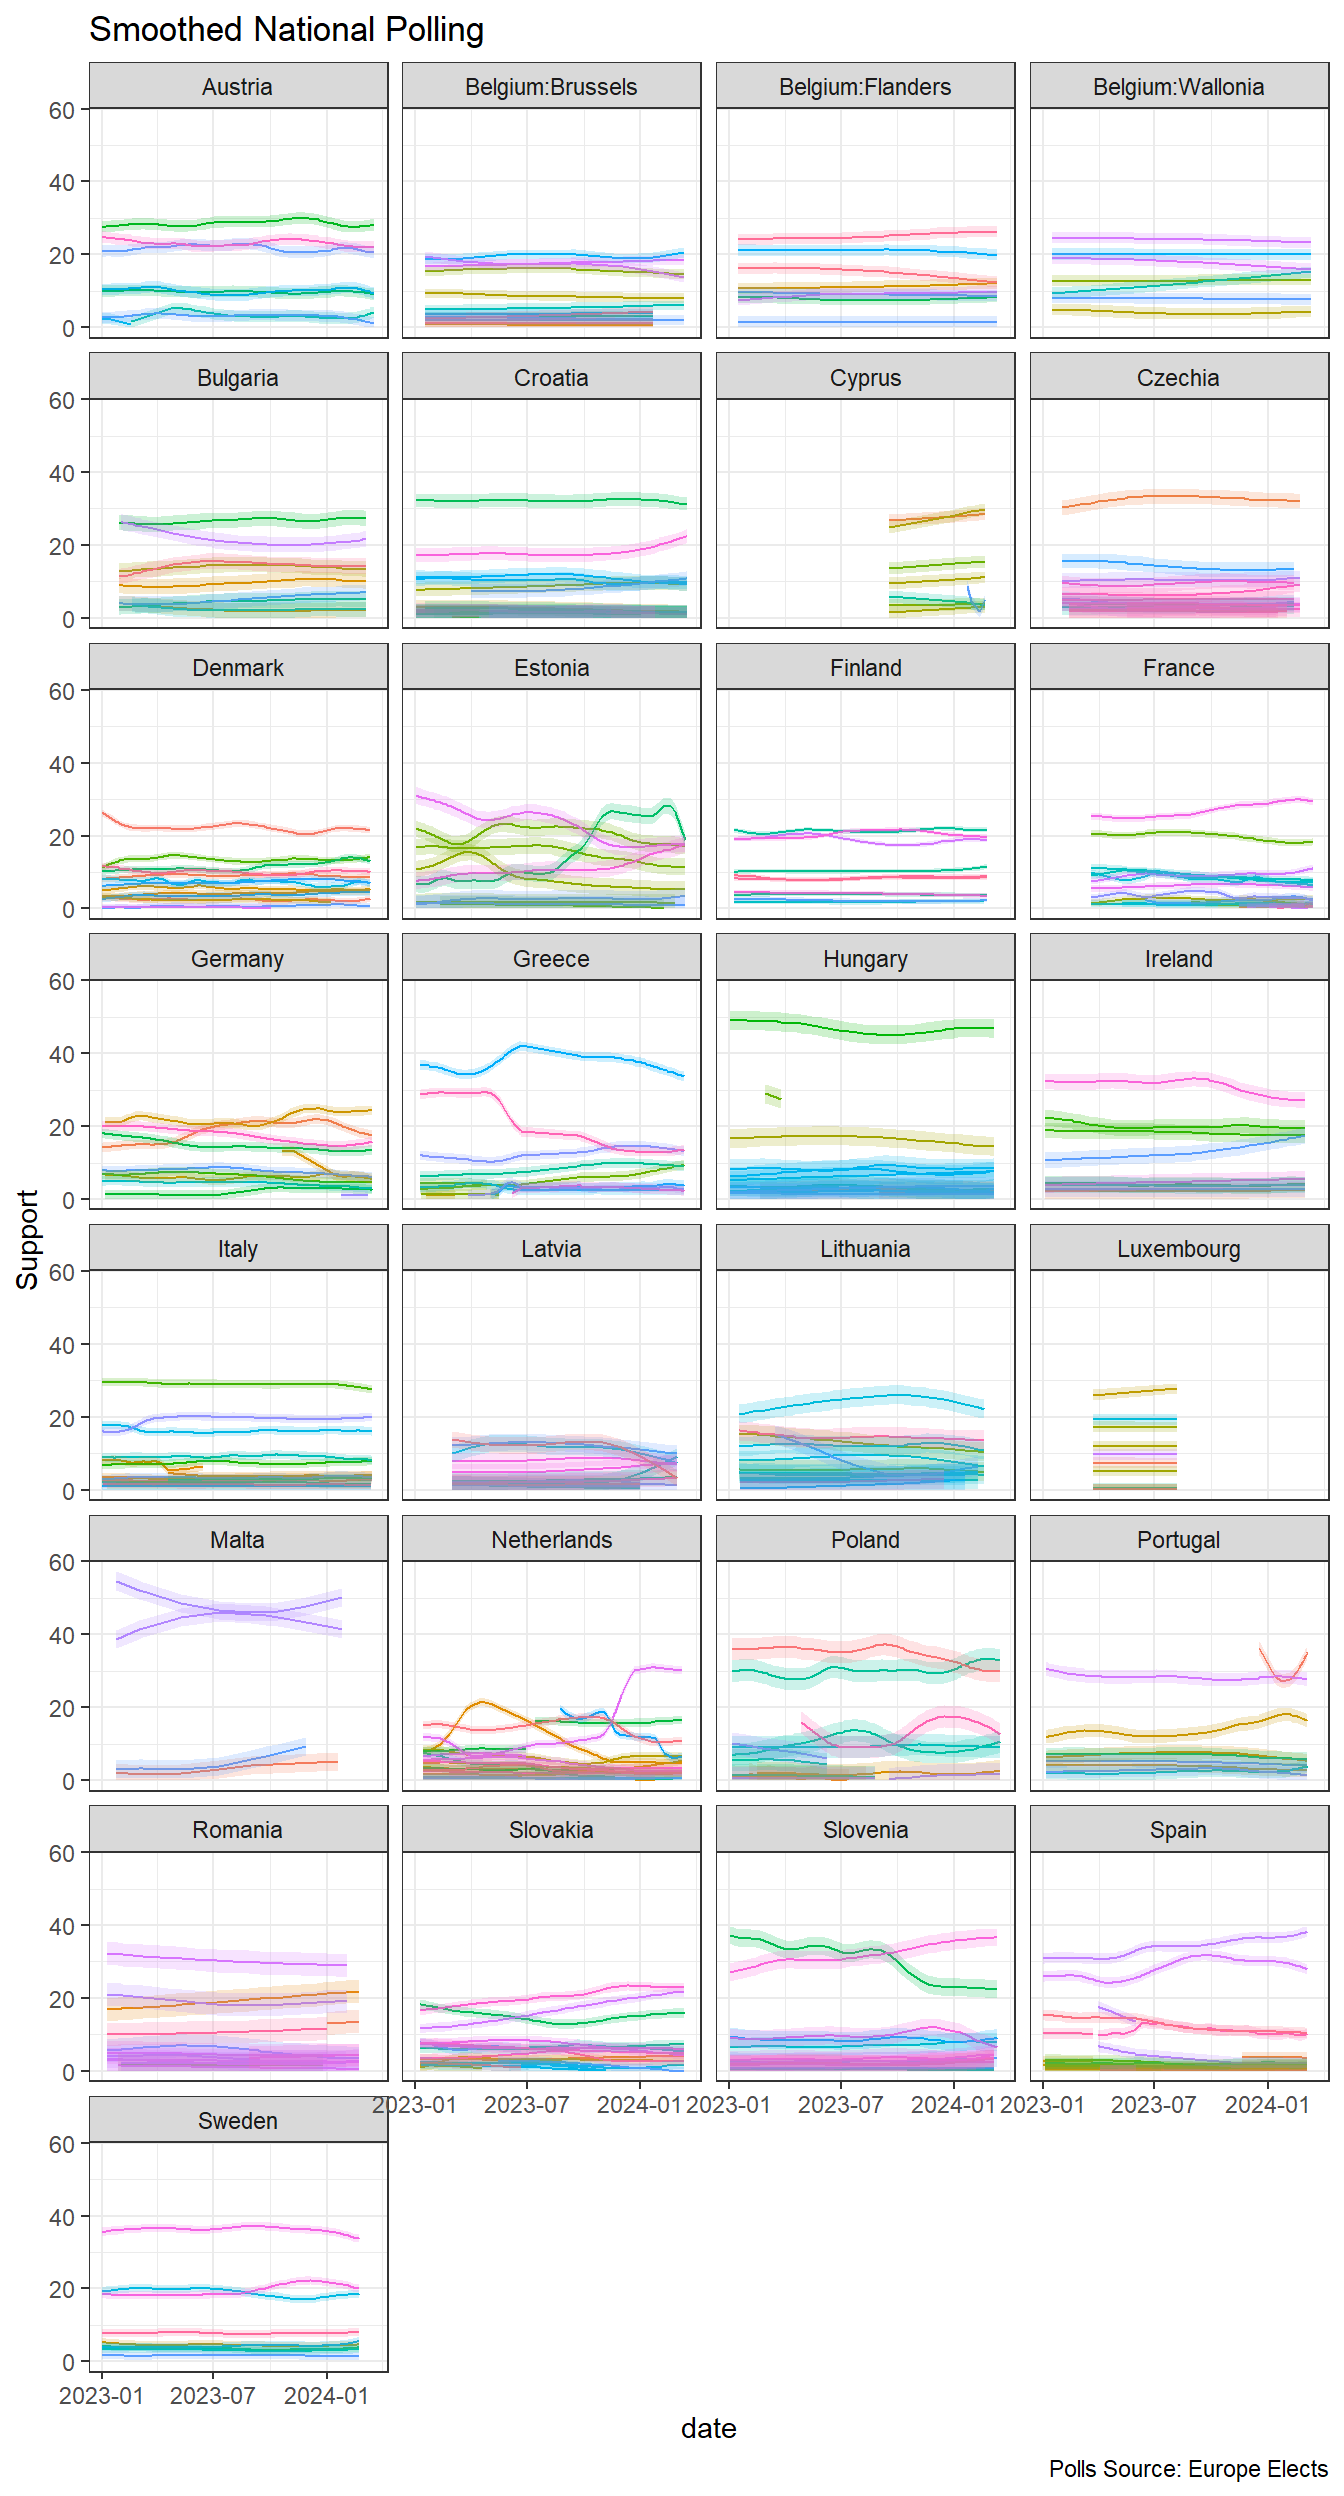
We get come information from the smoothing on how noisy the polls are (the confidence ribbon is wider in some countries than others).
Estimating Possible National Outcomes
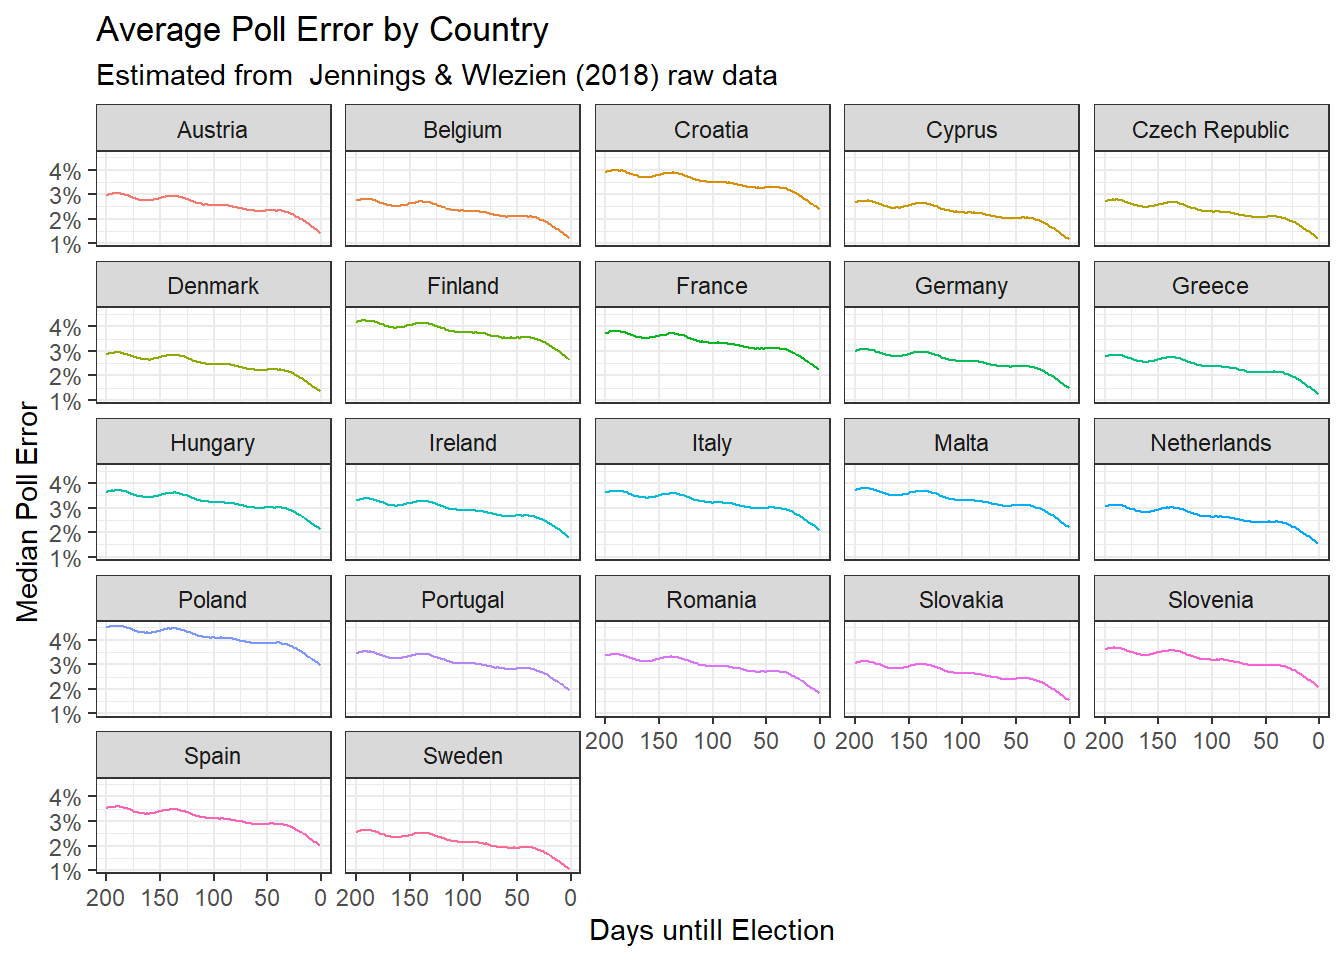
To fully estimate a plausible range of election outcomes we can pair this error with the historic error in polls (i.e that famous Jennings and Wlezien dataset where they collected polls and assessed polling error in 351 elections).
For countries they covered, we’ll use that. For countries they didn’t cover, we’ll just use the group average. In any case, because it is interesting in itself, here’s what the historic polling error for EU member states looks like, as a function of day from election:
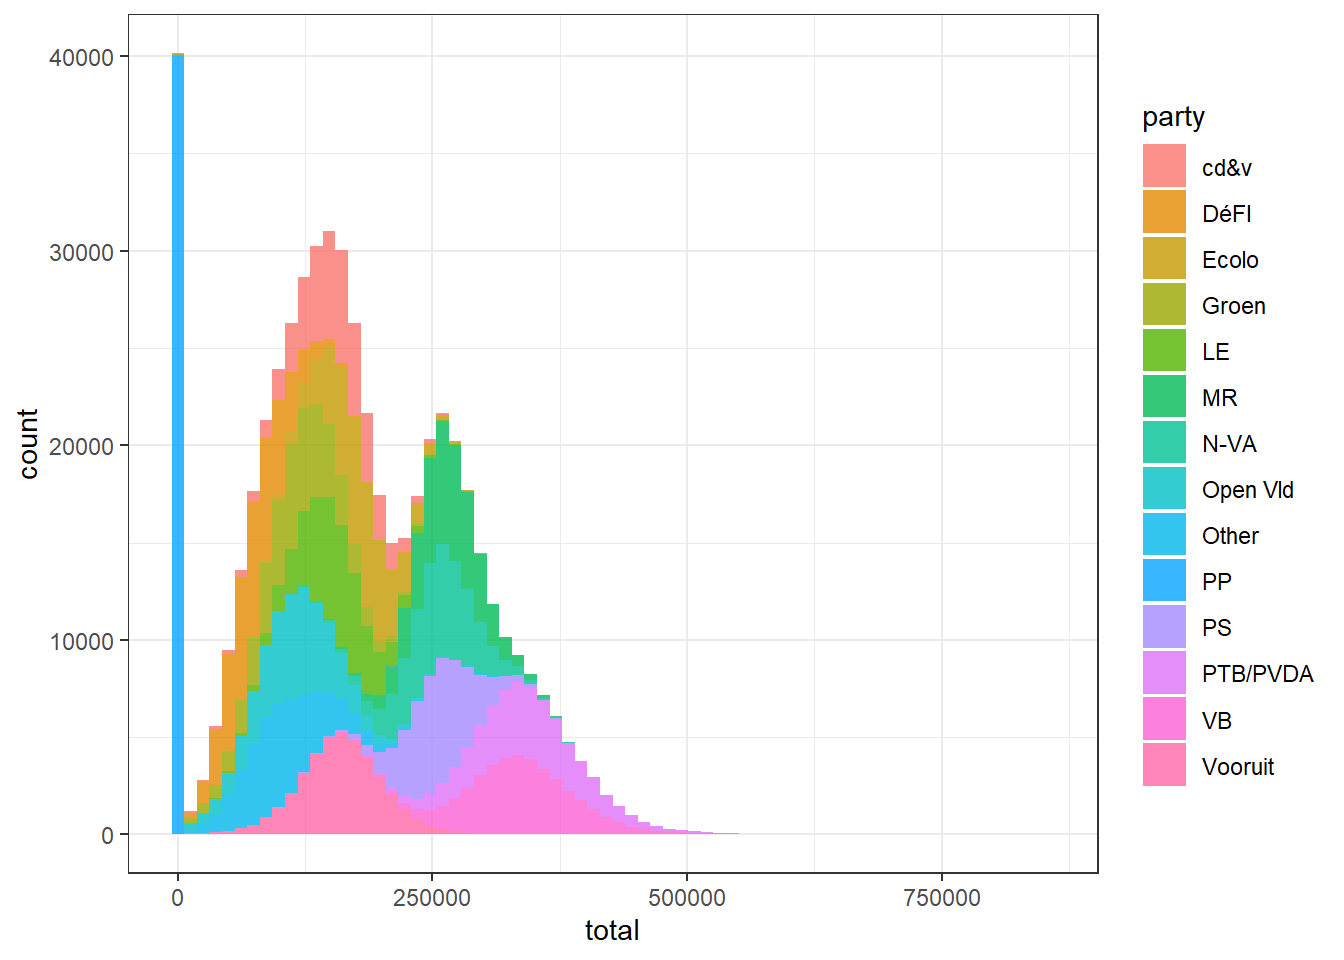
At the time of writing this, the election is 67 days ahead, so I’ll use the error from that point. Using those two possible sources of error as an indication of how much the polls can be off, we can calculate plausible vote shares on election day based on thousands of random simulations, which look something like this:
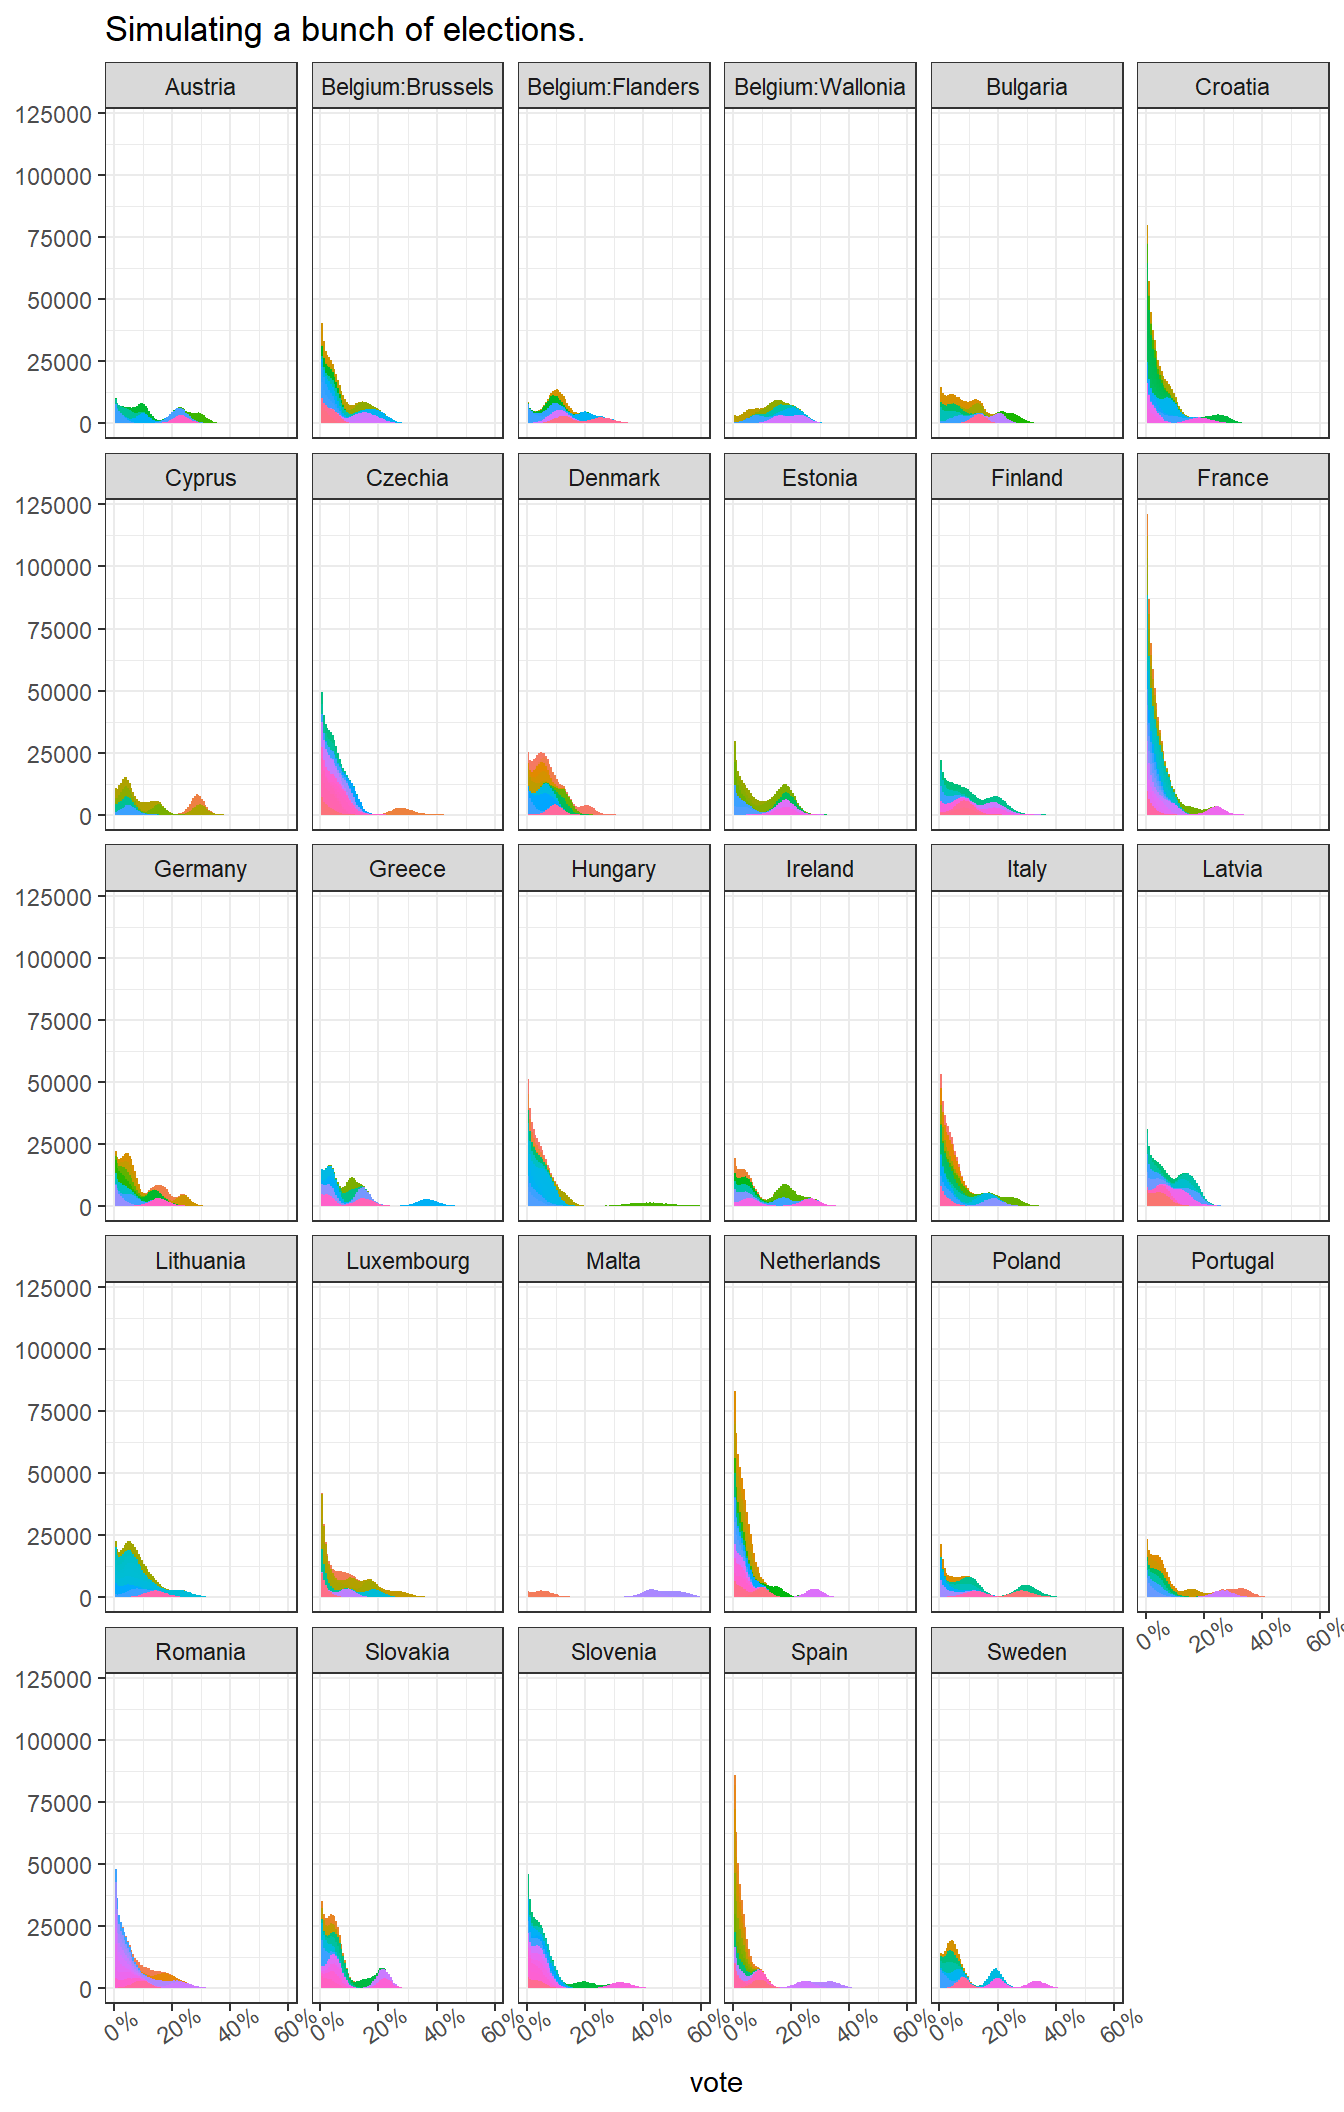
Each different coloured histogram is an individual political party, corresponding to it’s range of expected outcomes in terms of national vote share.
Side Quest: Belgium
Before we get any further, we need to sort out Belgium first. The least ‘bad’ way to do this I could think of was weighting by the 2019 vote. In 2019, Belgium cast the following votes for the European Parliament:
## # A tibble: 11 × 2
##    regionname                  n
##    <chr>                   <dbl>
##  1 Bruxelles/Brussels    6679708
##  2 Prov. Antwerpen       9171032
##  3 Prov. Brabant Wallon  1700972
##  4 Prov. Hainaut         5069190
##  5 Prov. Liege           6180040
##  6 Prov. Limburg (B)     4432704
##  7 Prov. Luxembourg (B)  1153817
##  8 Prov. Namur           2092937
##  9 Prov. Oost-Vlaanderen 7915504
## 10 Prov. Vlaams-Brabant  5371928
## 11 Prov. West-Vlaanderen 6371760
I’m assuming that each region belongs to an electoral college, roughly:
## # A tibble: 11 × 2
##    regionname            electoral_college
##    <chr>                 <chr>
##  1 Bruxelles/Brussels    Belgium:Brussels
##  2 Prov. Antwerpen       Belgium:Flanders
##  3 Prov. Brabant Wallon  Belgium:Wallonia
##  4 Prov. Hainaut         Belgium:Wallonia
##  5 Prov. Liege           Belgium:Wallonia
##  6 Prov. Limburg (B)     Belgium:Flanders
##  7 Prov. Luxembourg (B)  Belgium:Wallonia
##  8 Prov. Namur           Belgium:Wallonia
##  9 Prov. Oost-Vlaanderen Belgium:Flanders
## 10 Prov. Vlaams-Brabant  Belgium:Flanders
## 11 Prov. West-Vlaanderen Belgium:Flanders
Which would leave us with the following proportions:
## # A tibble: 3 × 3
##   electoral_college total_vote prop_v
##   <chr>                  <dbl>  <dbl>
## 1 Belgium:Brussels      510837  0.203
## 2 Belgium:Flanders     1191366  0.474
## 3 Belgium:Wallonia      810041  0.322
Allowing us to add a proportionate amount of the Brussels vote to the respective parties. (There is also a third German speaking electoral college in Belgium which has 1 seat. It is rarely polled and is safely assumed to lean Christian democrat).
Putting it all together we end up with:
Apportioning Seats
Using the distribution of vote shares to calculate the distribution of seats then becomes a matter of following the electoral rules in each country. By ‘following electoral rules’ I mean firstly applying any threshold to exclude parties below a certain vote share and then using the electoral method applicable in that country to assign the correct number of seats.
The wikipedia page for the 2024 elections actually has a nice table which we’ll scrape. For the actual seat crunching itself, we’ll use Jorge Albuja’s electoral package (the applicable method call to the electoral::seats function is what is in the final method column.)
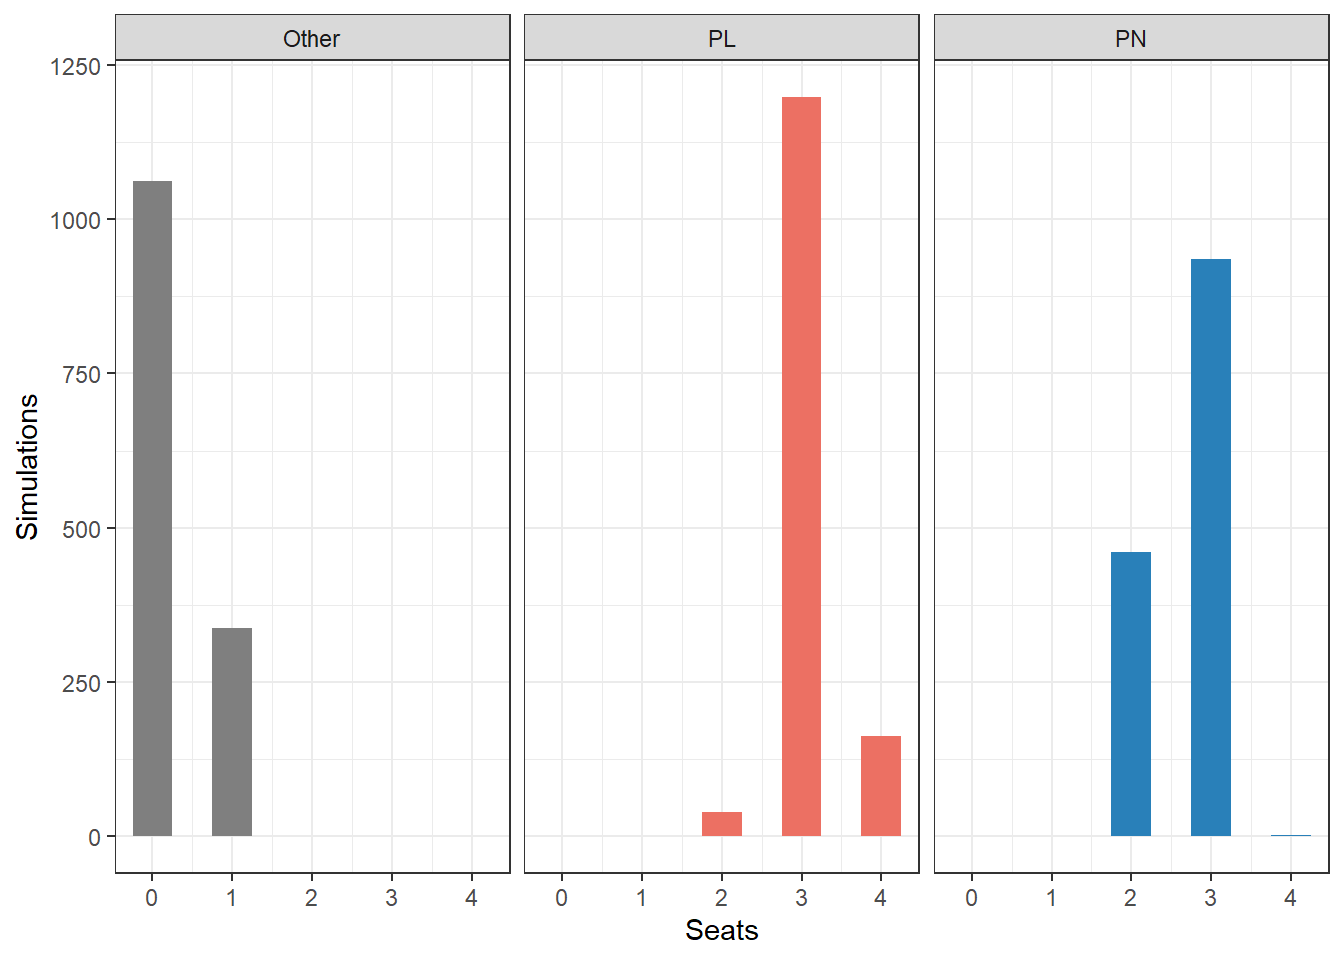
And maybe just to zoom in on what this means country per country, here is what Malta’s simulated runs look like. You can see that the most probable outcome is 3 seats for PL and 3 seats for PN, but 2 PN seats is also a highly oberved possibility. There’s also a fair chance of a third party or independent candidate snagging a seat.
Now strictly speaking, this sort of estimation in Malta and Ireland is problematic, because those two countries use STV, which allows the electorate to vote for the individual candidates themselves. The polling we have is party based, so it isn’t a fully accurate reflection.
Another thing this probability at a national level estimate ignores is for example parties associated with a particular group having a really good or bad time consistently across different countries (for instance a sweep of Green parties in central Europe). It would be really cool to add this covariance, but I can’t think of an easy way to do it for now.
The last bit of the puzzle is then mapping where each elected party fits in the European Parliament’s political groups using a look up table. This was easier for some parties than others, since some are independent members, others have given no indication which political group they might join and others yet might not be accepted into the political group of their choice.
The overall best guess is this:
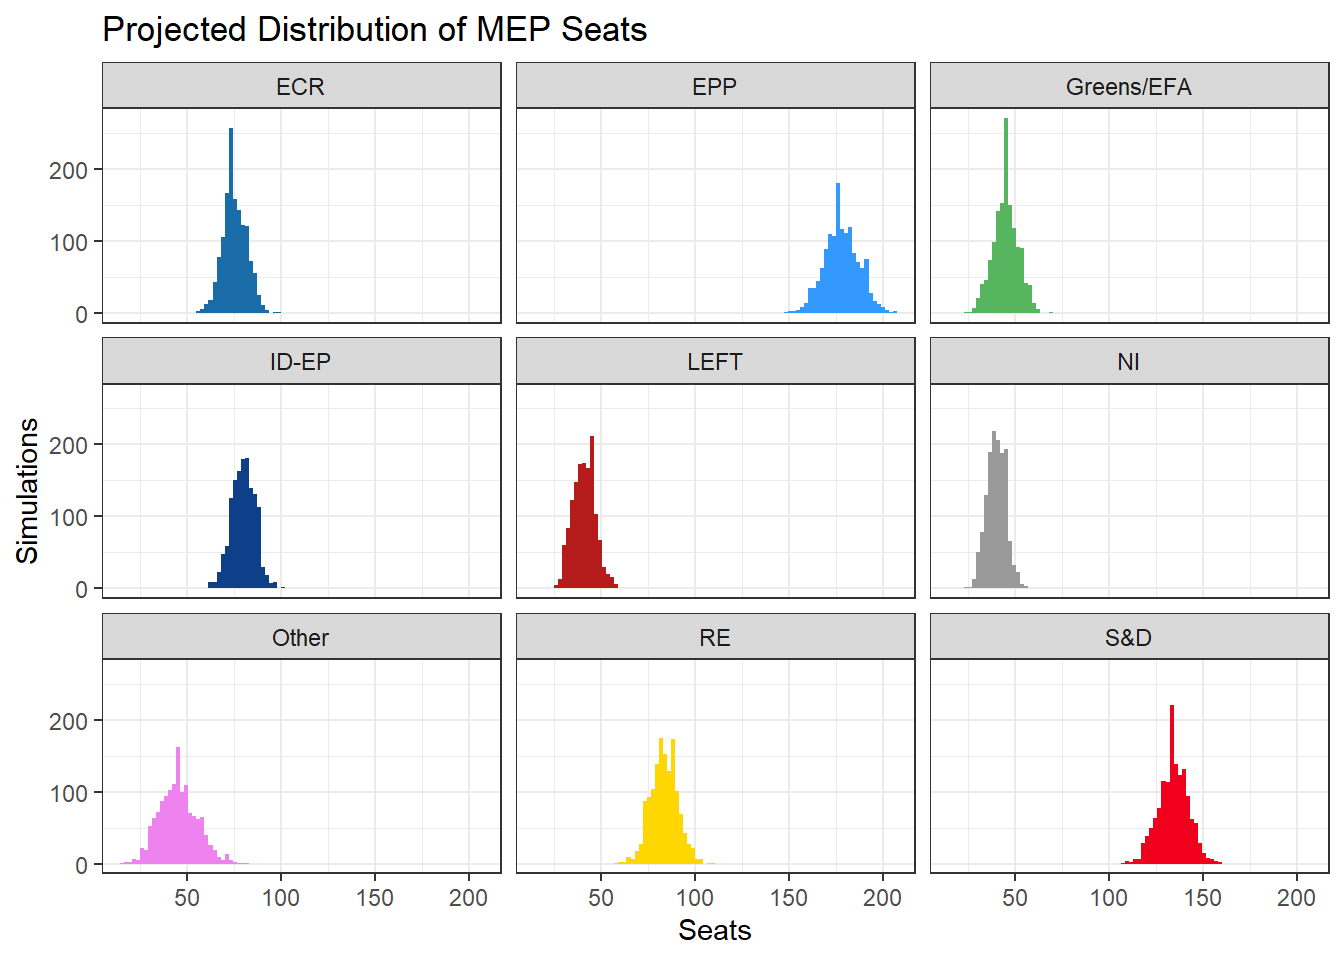
But one advantage of building up this thing this way is we can also get a probabilistic estimate of what seats for each party look like:
Or maybe a bit clearer ‘top down’ view of the above histograms:
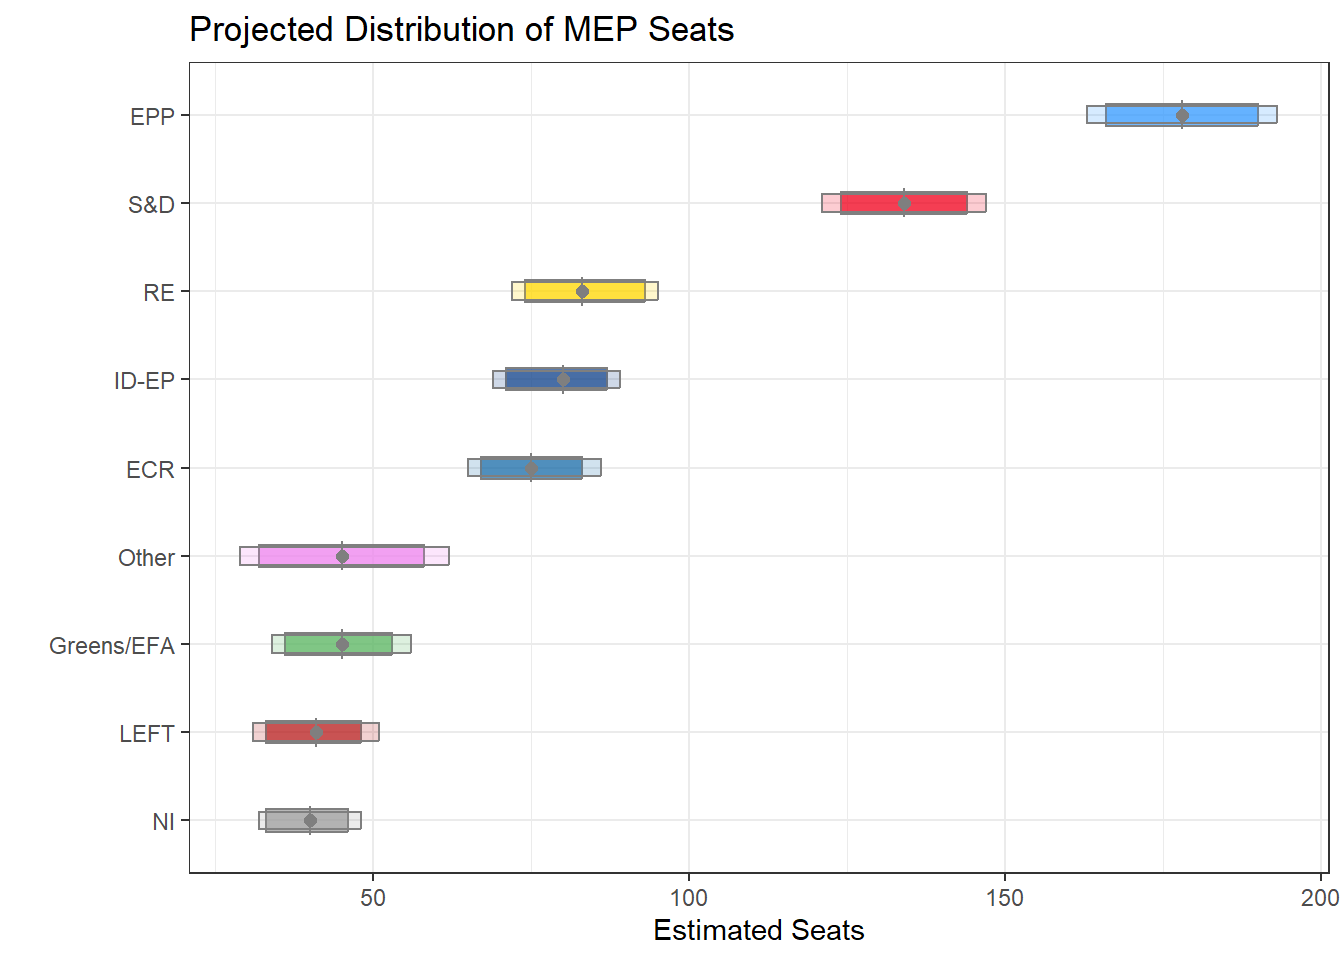
There’s a small bias due to the fact that parties aligned with EPP and S&D are a bit more reliable at making this alliance known. In other words the ‘Other’ category should in reality be close to single digits, with most of that going to the smaller groups instead. There’s also a related issue of some national polls having an ‘Others’ category lumping all the smaller parties together. Maybe the best approach would be to get rid of this altogether.
I should probably mention that Europe Elects themselves have a pretty nifty EP forecast here.