This is a high level article on the UAV operations. If you want more background on how I load and store the data, head here.
Reports in a number of portals including Times of Malta show that an unmanned aerial vehicle has been deployed from Luqa airport. The timing, right ahead of the typically busy summer migration time, seems to be an indication of what the main mission probably is.
Frontex has been thinking of operating a UAV for over a decade now, and it seems to have come in the form of an IAI Heron. “Drone” is a bit of a misnomer for this type of system, since in most people’s heads it’s associated to consumer grade toys like the DJI Phantom.
The Heron is slightly larger than most small single engine aircraft, with slender and 16 metre long high aspect ratio wings, a 430kg fuel capacity, an engine as powerful as an average family car and needing around half a kilometer of runway for takeoff and landing.
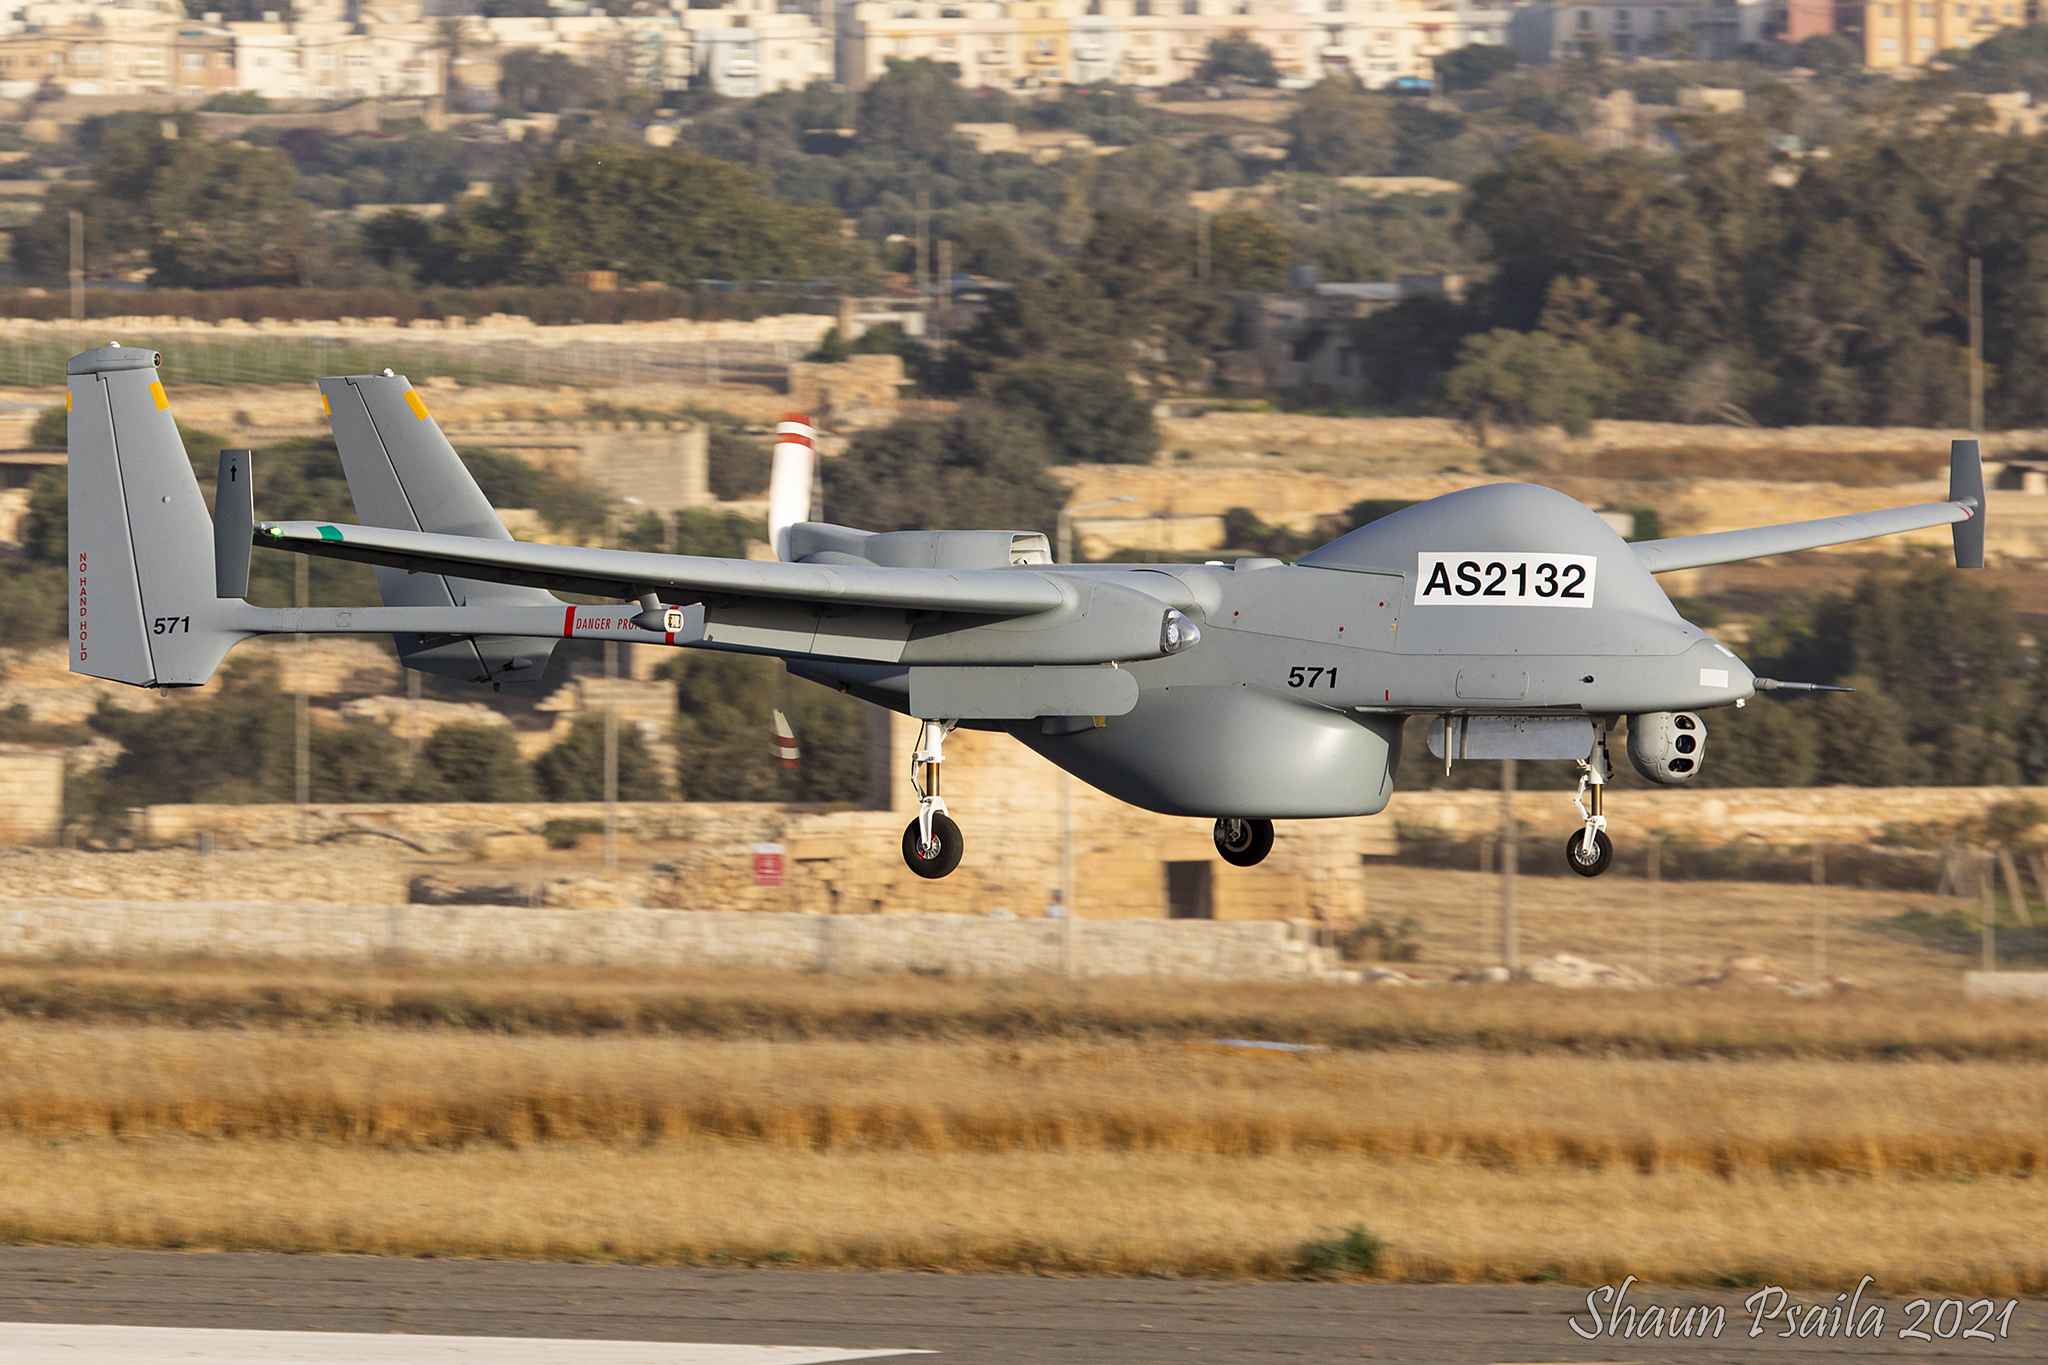
From photos taken by local spotters, the Heron seems to be carrying Israel Aircraft Industries’ own native M19 sensor payload giving the aircraft the ability to track boats even in the dark or through clouds. On paper, the aircraft is almost tailor made for border surveillance applications of the type Frontex engages in, with the ability to loiter at the periphery for close to 50 hours at 30,000 feet.
IAI quotes the range as 350 kilometers when in radio communication mode with a ground station and 1,000 kilometers when a satellite is used to relay the signal:
The subject as to who does the actual “operating” isn’t so clear however. This press release by Airbus seems to suggest that they set up the ground infrastructure and fly the aircraft, but the Heron has been given a standard AFM Air Wing ASXXXX registration, with the first two digits indicating the year of registry (2021) and the last two being the cumulative count of the aircraft (23rd aircraft operated by the Air Wing).
In any case, as soon as the news broke, I began looking into ways to track and visualize how Frontex is using their latest asset. As mentioned in the methods post, all data is gathered from the OpenSky Network ADS-B logs.
To get a track of all recorded flights, I simply query my SQLite database (again, head to the method’s post for a breakdown of how I did that, if that’s your cup of tea) using DBI ’s dbGetQuery function.
giscoR is a fun library for EU state mapping, which in this case I use to get a Malta spatial object to add to my plot, before overlaying the flight tracks of the UAV.
library(DBI)
library(tidyverse)
library(giscoR)
library(lubridate)
library(scales)

WD <- "C:/Users/Charles Mercieca/Documents/RProjects/Heron Tracker/Flights"
mydb <- dbConnect(RSQLite::SQLite(), paste0(WD, "/heron-flights.sqlite"))

tracks <- dbGetQuery(mydb, 'Select * FROM tracks') %>%
  mutate(flight = date(as_datetime(flight)))

mt <- gisco_get_countries(resolution = "01", country = "MLT")

ggplot() +
  geom_sf(data = mt)+
  geom_path(data = tracks,
            aes(y=Lat,
                x = Lon,
                col = factor(flight)))+
  labs(col = "Day")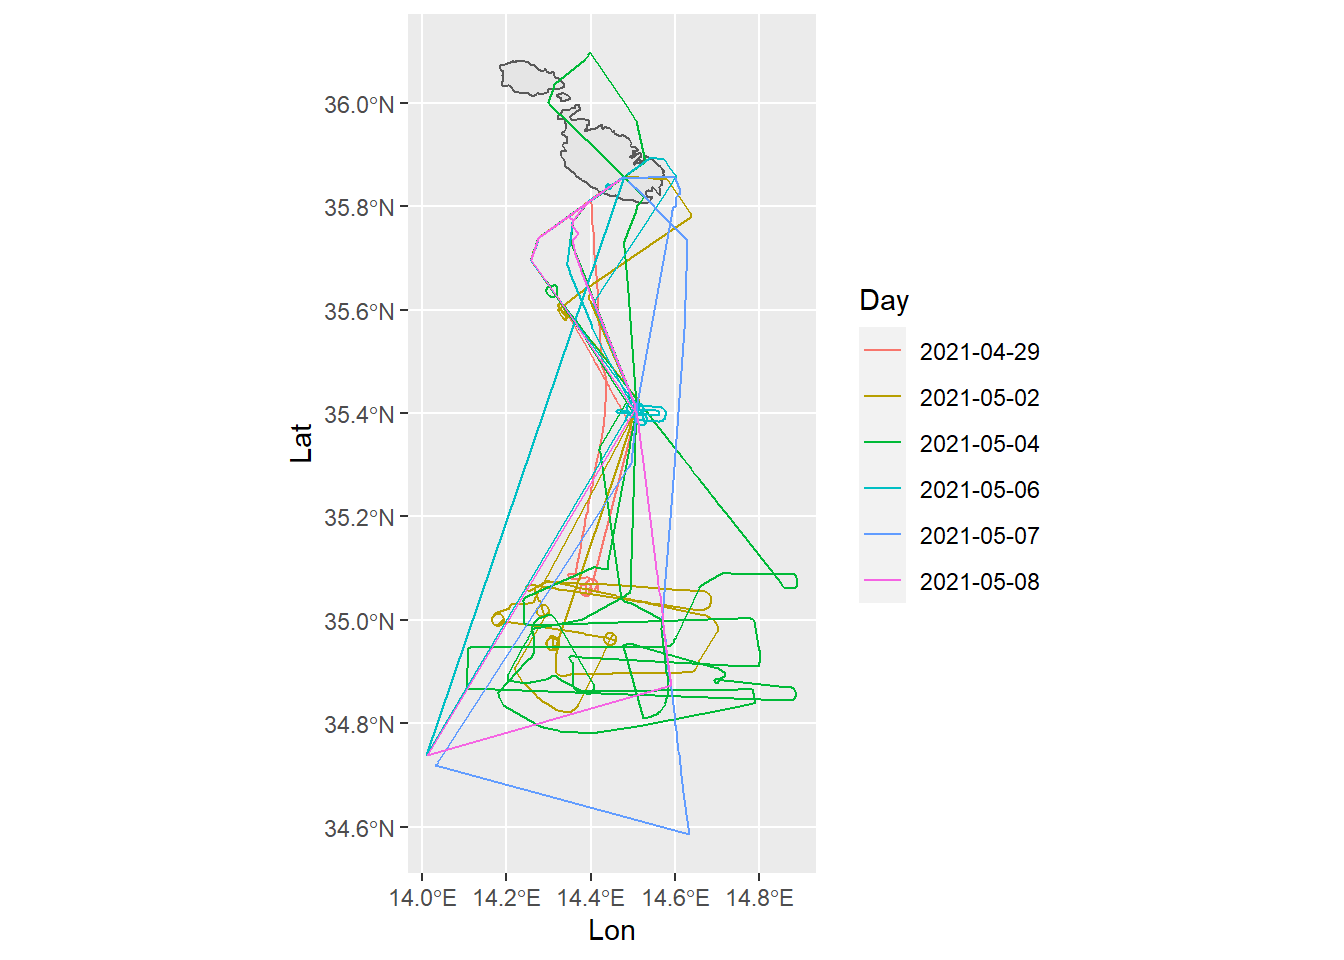
While they are a phenomenal source, the fact that they are not a for-profit mean they don’t have as much coverage as say FlightRadar24, particularly off the North African coast. This is evident in the tracks for the 6th and 7th of May, where coverage stops close to 34.6N. On both these cases, the aircraft spent most of the night flying over the southern Mediterranean close to the Libyan coast.
Track wise it was also interesting to see the operators slowly expand their safety envelope: for their first flights they lauched the aircraft to the south west and recovered in the opposite direction to the north east: this area over Dingli is largely devoid of any population. But after a few flights, they seemed comfortable to take off from runway 05, over Marsa and Valletta, overfly a bit of Gozo and shoot an approach for runway 13, flying overland most of Malta.
As part of the ADS-B message, we also get the aircraft’s barometric altitude, which shows us that the Heron hasn’t been flown over 8,000 feet yet, at least while we were intercepting ADS-B logs. It’s typical operating altitude is closer to around 4,000 to 5,000 feet.
ggplot(tracks, aes(x = as_datetime(time), y = Alt, col = factor(flight)))+
  geom_point()+
  facet_wrap(~flight, scales = "free_x")+
  theme_bw()+
  labs(col = "Day")+
  theme(legend.position = "none")+
  ylab("Altitude (feet above Sea Level)")+
  xlab("")+
  scale_y_continuous(label=comma)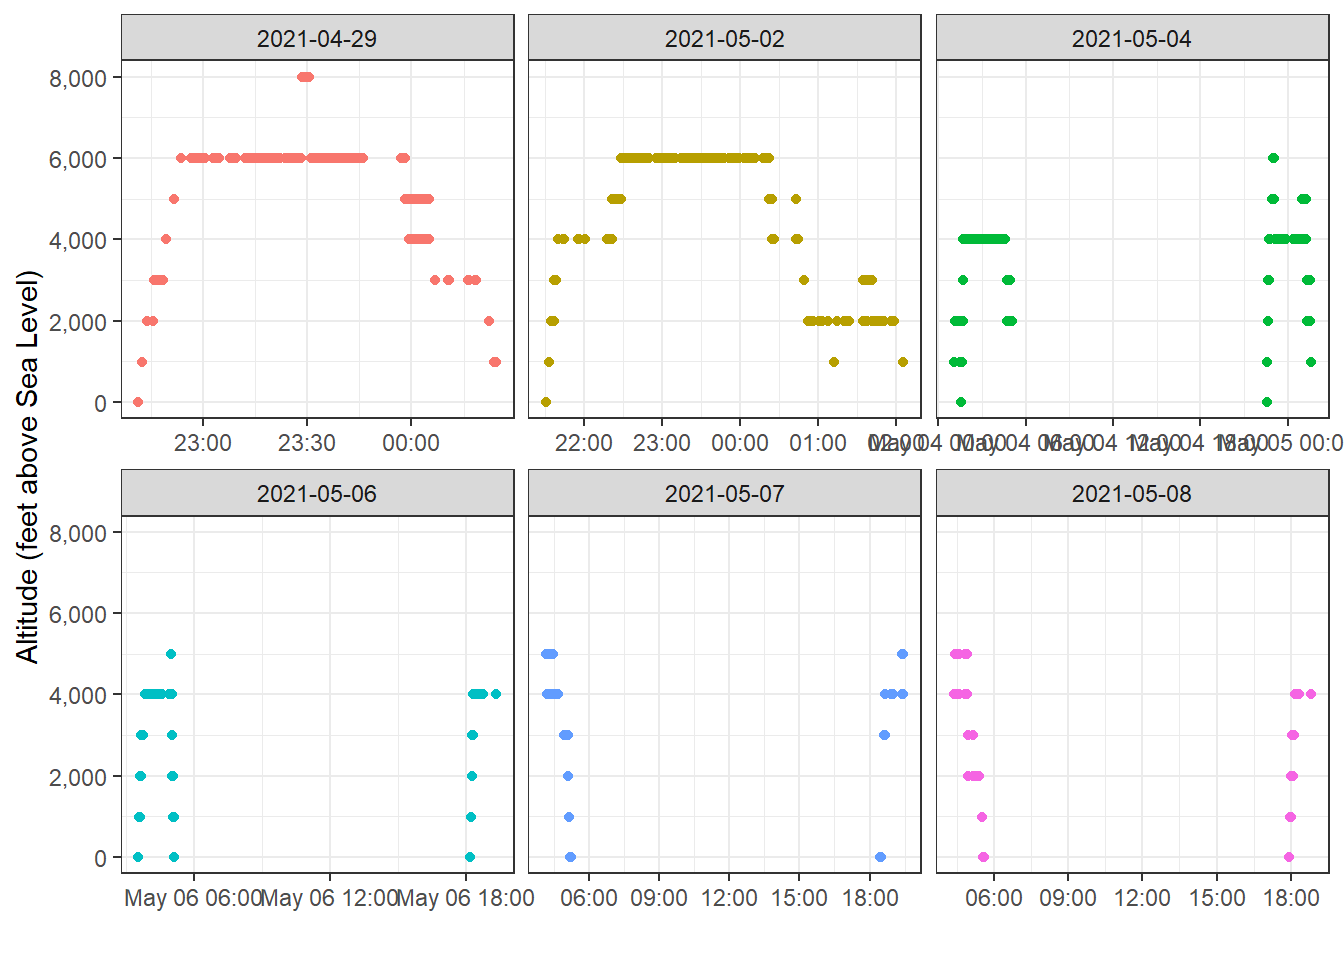
While speed is part of the ADS-B payload, I suspect OpenSky Network truncate it to save space. Nevertheless, we can infer ground speed by calculating the distance between the current latitude/longitude coordinates and the lagged coordinates by 1 step like this:
mutate(Lat2 = lag(Lat),
             Lon2 = lag(Lon),
             t = difftime(time, lag(time), units = "hours")) %>%
      rowwise() %>%
      mutate(d = geosphere::distHaversine(p1 = c(Lat, Lon),
                                          p2 = c(Lat2, Lon2))*0.000539957) %>%
      ungroup() %>%
      mutate(knots = d / as.numeric(t))
the distHaversine function returns the great circle distance between the two pairs in metres, which I then convert to nautical miles by multiplying by 0.000539957.
Dividing this distance d by the fraction of hours elapsed over the two readings t gives us an inferred ground speed in nautical miles per hour, or knots.
tracks %>%
  group_by(flight) %>%
  mutate(flightTime = cumsum(replace_na(t, 0))) %>%
  ggplot(aes(x = flightTime, y = knots, col = factor(flight)))+
  geom_point()+
  ylim(c(0,200))+
  facet_wrap(~flight, scales = "free_x")+
  geom_smooth(method = "loess", se=F, col = "black")+
  theme_bw()+
  ylab("Inferred Ground Speed (knots)")+
  xlab("Flight Time (hours)")+
  theme(legend.position = "none")
## `geom_smooth()` using formula 'y ~ x'## Warning: Removed 31 rows containing non-finite values (stat_smooth).## Warning: Removed 29 rows containing missing values (geom_point).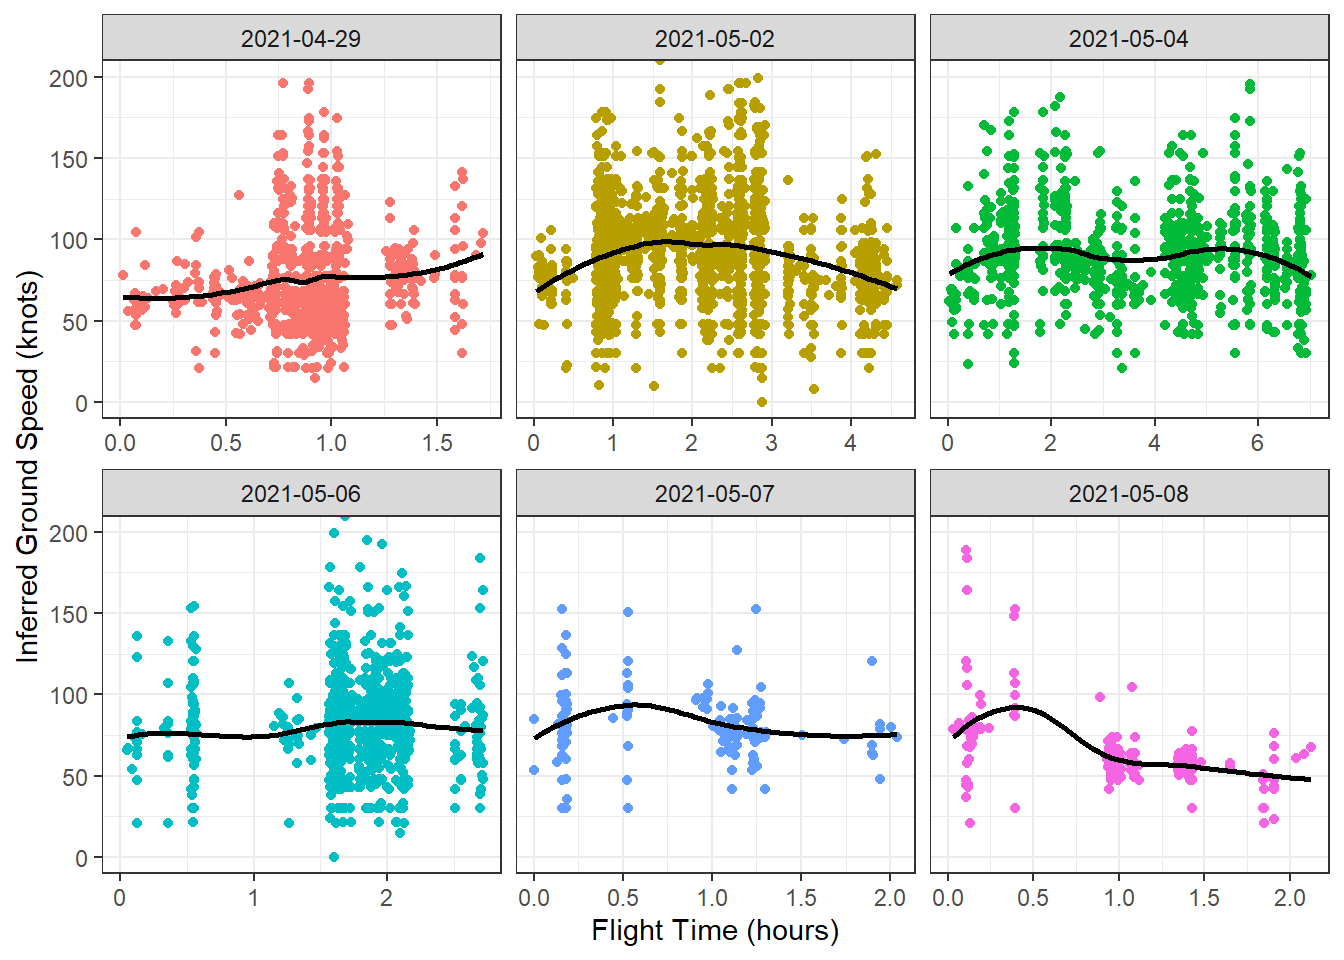
For the most part, this approach works well, with an estimated ground speed in the region of 70-100 knots being what you would expect. Exceptionally high values (150+ knots) are mainly due to a quirk of this method in that it measures the shortest possible distance between two points. Over the two recorded time points, the aircraft might have of zig-zagged, circled or flew in a curve.
Lastly, we can compute a few quick summary statistics. We have the aircraft on record as flying a total of 1,600+ nautical miles
tracks %>%
  select(d) %>%
  sum(na.rm = T)
## [1] 1689.674and
tracks %>%
  select(t) %>%
  sum(na.rm = T)
## [1] 20.18278over 20 hours.
The ADS-B logs also help tell us a bit about the aircraft origins. The mature serial number (571) hints that the aircraft was manufactured recently, with a demonstrator at a 2012 airshow having a 268 serial. But more pertinently, the transponder’s ICAO 24-bit address (A11111) shows two test flights in late March 2021 from Ein Shemer airfield, about 40km south of Haifa, which seems to be where IAI operates the Heron program from. The one month hiatus sounds about right for then disassembling the aircraft into a container, trucking it to Haifa, transporting it by sea and reassembling it.
The proof of the system’s utility will be in how much more life can be saved in the southern Mediterranean this summer.