What is this and why?
An election forecast that tries to:
Project a more accurate picture of what might happen on election day using aggregations of public polls (in the hope that there is wisdom in crowds).
Quantify all we know about the election and how it might unfold onto a probability space.
It was inspired by popular forecasts that appear on fivethirtyeight.com, The Upshot or The Economist. I actually borrow a great deal from The Economist’s French Presidential Election model here, whose G. Elliott Morris makes it a point to opensource these projects.
How?
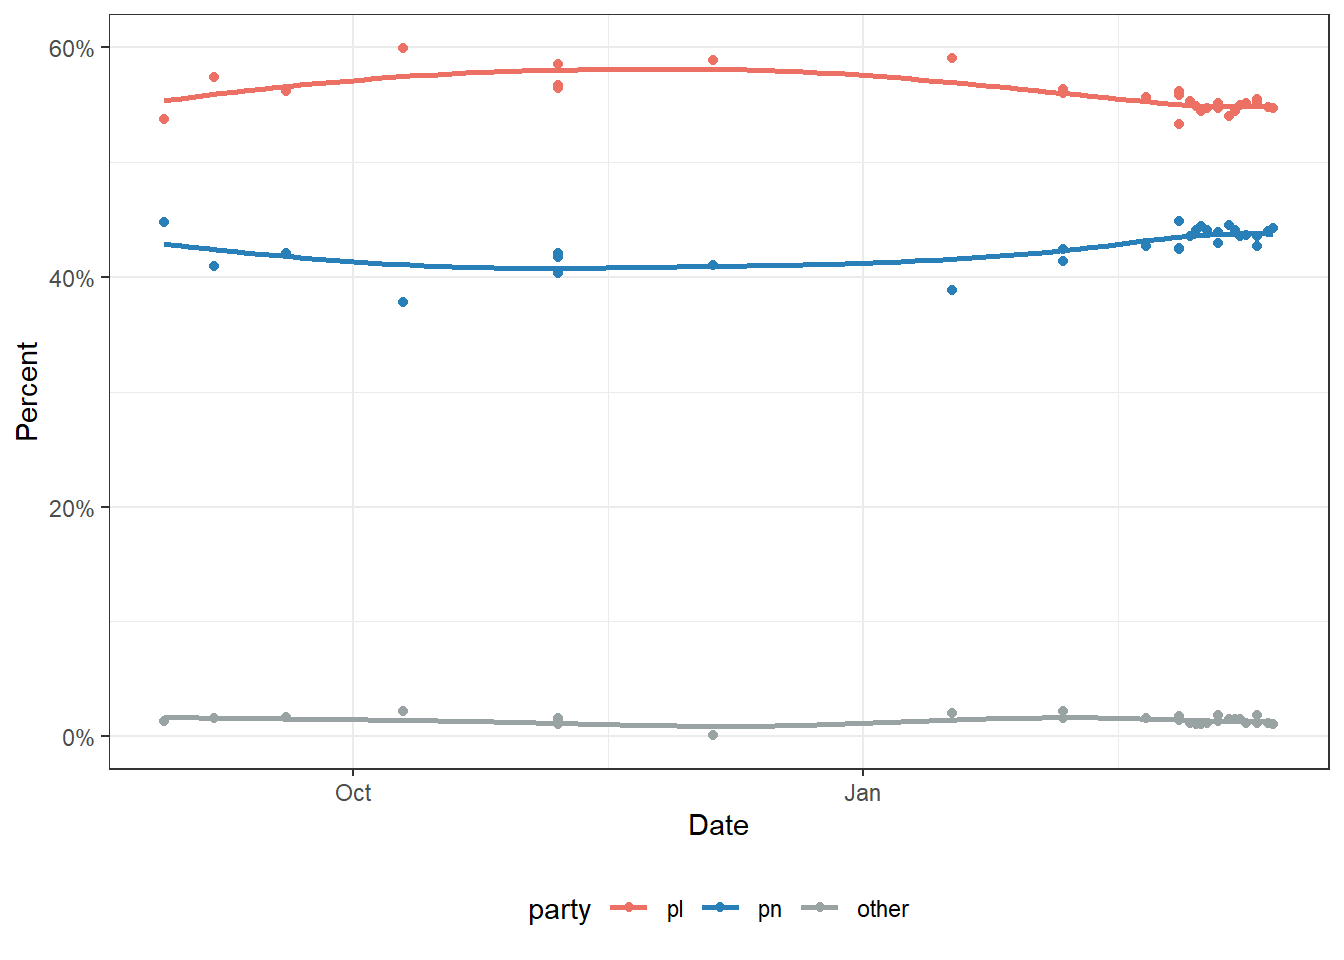
Step 1: Aggregate Polls
Public polls are the main source of data going into the model. I’ve been keeping a tally of all published polls from MaltaToday, Sagalytics and Esprimi for a few years now in a spreadsheet. Sagalytics and Esprimi have a habit of releasing their polls as interpolated, while MT still give individual breakdowns. To align them, MT’s were interpolated by summing up the individual party share as the denominator.
I lumped the smaller parties into one single ‘Others’ category. A GAM spline was used to smooth the individual polls. Here we also took note of the error between the spline and the individual polls. Large errors would mean that different polls are showing a wider spread, which means more uncertainty.
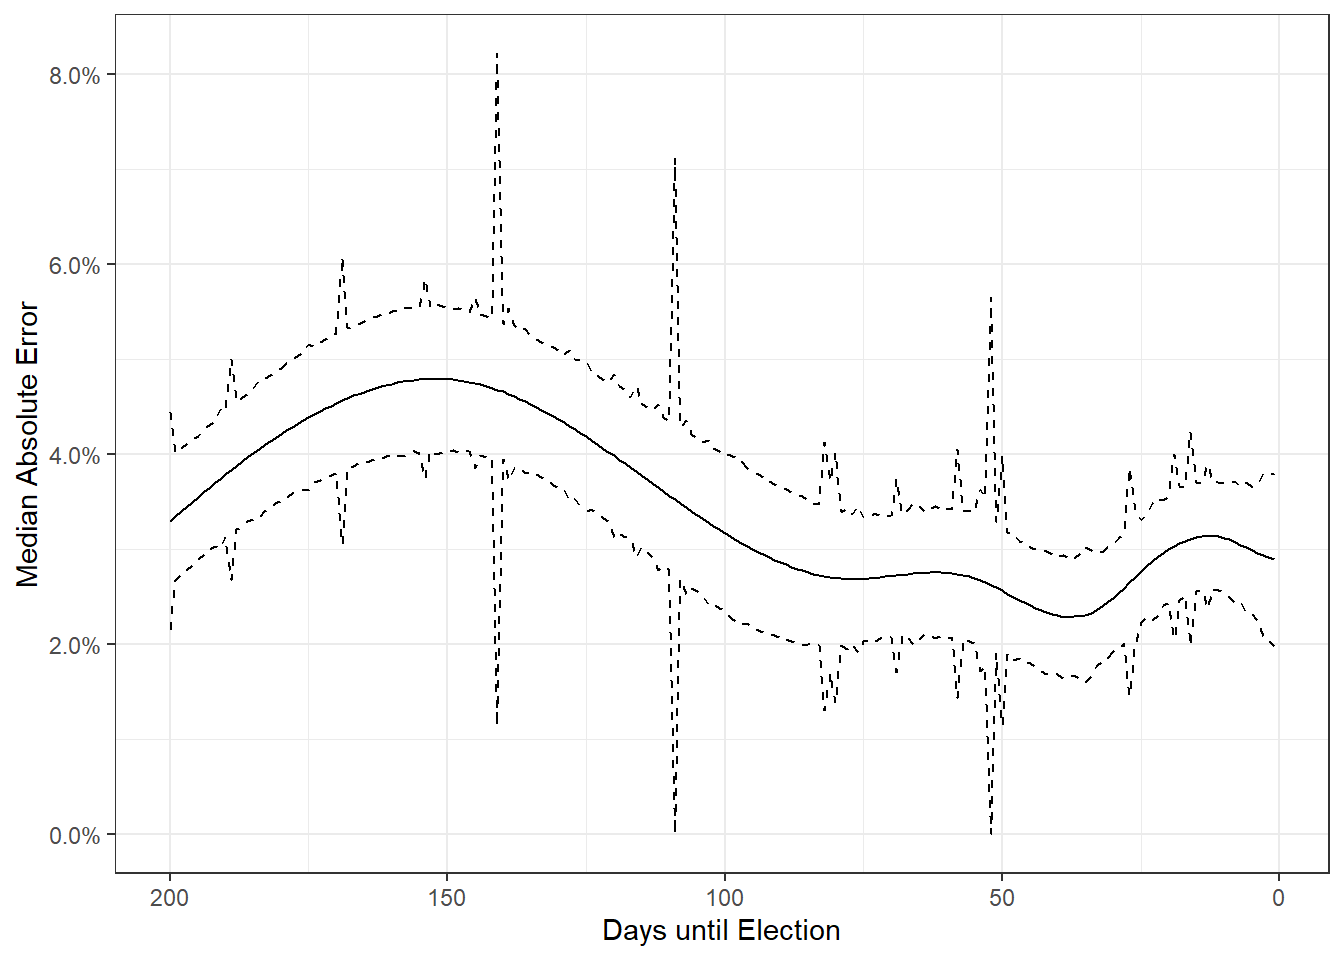
Step 2: Historical Error
The above step gives us two pieces of information. The relative standing of the parties at a point in time, and how noisy or variable that estimate is. But we also need to calibrate for how accurate polls in Malta are. To do this, Elliott Morris actually used an academic dataset from Will Jennings and Christopher Wlezien written in the 2016 Trump and Brexit upsets aftermath to show that polls are still accurate. To prove this they collected polls worldwide for the past 50 years or so.
Unfortunately the only data they had for Malta were 3 polls for the 2013 election. I had also collected poll aggregates in the months leading up to the 2017 election, so I used these to supplement that. This part was then a literal copy-paste job from The Economist.
The end result is the median absolute error from the election day result as a function of days to go to the election. The elegance of this approach is that this isn’t just the ‘margin of error’ that’s frequently quoted (i.e. any accounting for the randomness of the sample), but also takes into account systemic things like for instance one group being easier to reach or non-reply to surveys. In the final 90 day stretch of the election, that absolute error tends to be around 3%.
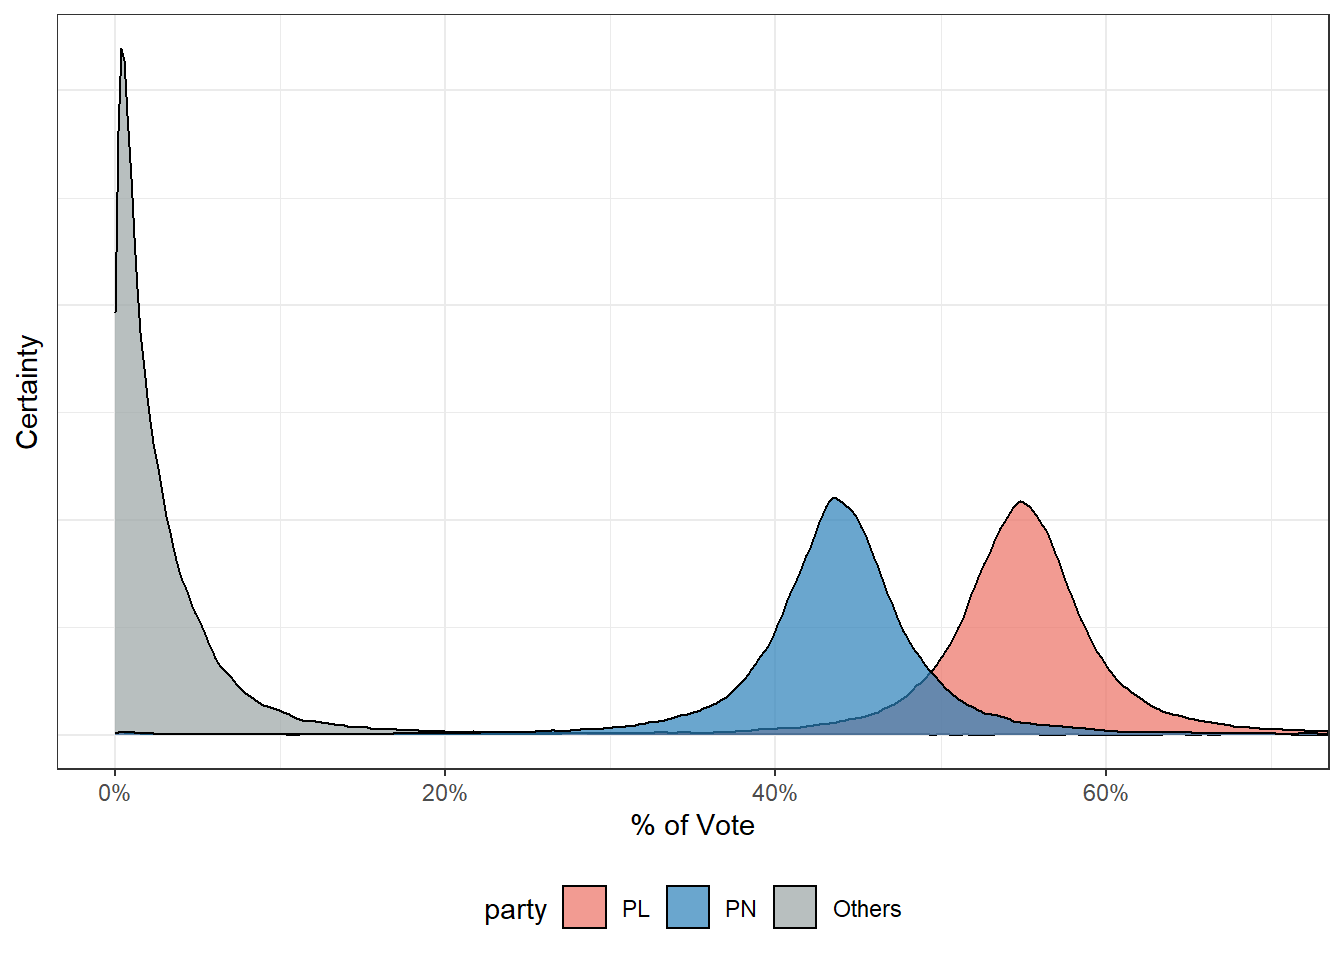
Step 3: Combine Errors and Simulate
The final step is them to combine these errors into a single difference from the polled number we might see on election day. To do this and account for all possibilities, the observed errors are assumed to be t-distributed. 40,000 draws from this distribution are then picked at random.
All further statistics are then essentially counting e.g. the number of simulations PL won, the median vote share PN obtained.