This post will feature a general rant before diving into these topics:
District Trends
Polling Error
Shift of Electoral Support
Did the Gender Quota misfire?
Small Parties/independents in this election vs. others
How do Chits and sampling help the parties call the election?
Rant Before the Graphs
That was a weird election, and not so much in the overall result. That bit we sort of knew for ages in advance. But what the win was composed of, was unexpected. We saw a few established parliamentarians lose their seats, while a number of first time contestants won big. Arnold Cassola ran the most impressive independent campaign we’ve seen in decades, and PL managed to prove those margins can endure even without Muscat or Schembri around.
But, before we get to the data, it’s important to dispel some of the bad takes making the rounds. PN’s poor performance is not due to it having to be historically the party of the ‘coalition between liberals conservatives and moderates’. That’s simplifying things too much, and it doesn’t tell us nearly anything useful.
For starters, the breadth of shades in PL’s tapestry is often underestimated (you’ll find everything from intensely theoretical Marxists to relatively conservative church folk if you look hard enough). Then there’s been PL’s noticeable lurch towards the center political space in the last 10 years, which means if anything, PL is the new party of compromises, not PN.
But somehow, despite not having a shred of evidence, this nugget of ‘common knowledge’ endures, just like the other nugget everyone parroted 15 years back that ‘elections are won by a few thousand floaters’.
Another exceptionally bad take is that Graffiti or AD are now poised to make some huge surge, cannibalizing PN voters. I don’t think most PN voters, even sour ones, will ever be comfortable in either reactionary or green politics, but that’s beside the point. Graffiti is not a political organisation of any sizeable influence or competence. It is a reactionary force that acts as a conduit for anger. The second whatever the aims of Graffiti are at the moment achieved, they will find new causes to be react against.
And while AD on the other hand does have some semblance of a party and the desire to actually pass policy, I think it has become clear (especially in this election) that Green politics has a national ceiling of probably less than 2% (which would be in line with other countries like the UK).
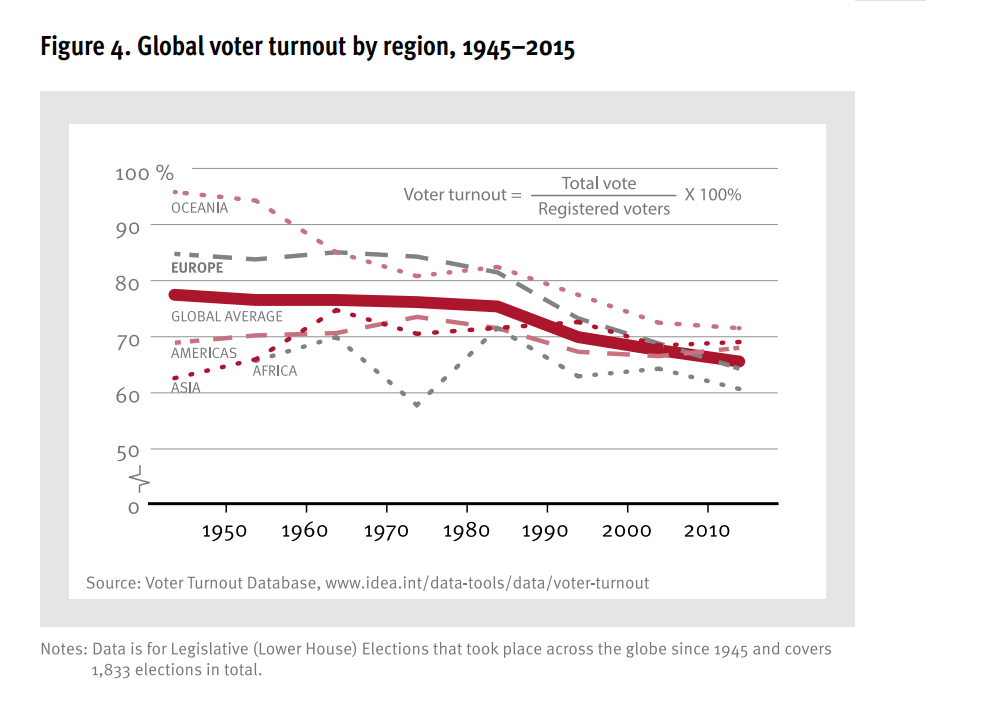
Lastly, I’d be weary on reading too much into the low turnout. Numerous commentators have jumped on this, but the fact of the matter is that in the first ever election during a pandemic, the absence of mail voting coupled with record low airline seat capacity, and an uncompetitive run up, the relatively poor showing can be due to any number of reasons. I think it’s also possible that we’re regressing towards the international mean to to speak, with voter turnouts having been declining since the 1980’s, especially in the West.
It also strikes me a bit odd that people chastise the Maltese voter for being fervently polarized on the one hand, and then attribute apathy as being something ‘wrong’ at the first occasion. Rant over, onward to the data.
District Trends
One part of the story on election day can be more clearly grasped by looking at district trends from the early 1990s to this year. The below graphs lump first count votes between PN, PL and Others (any smaller party or independent candidate) across the 13 electoral districts. The black dashed line is PN’s national voteshare, just for reference.
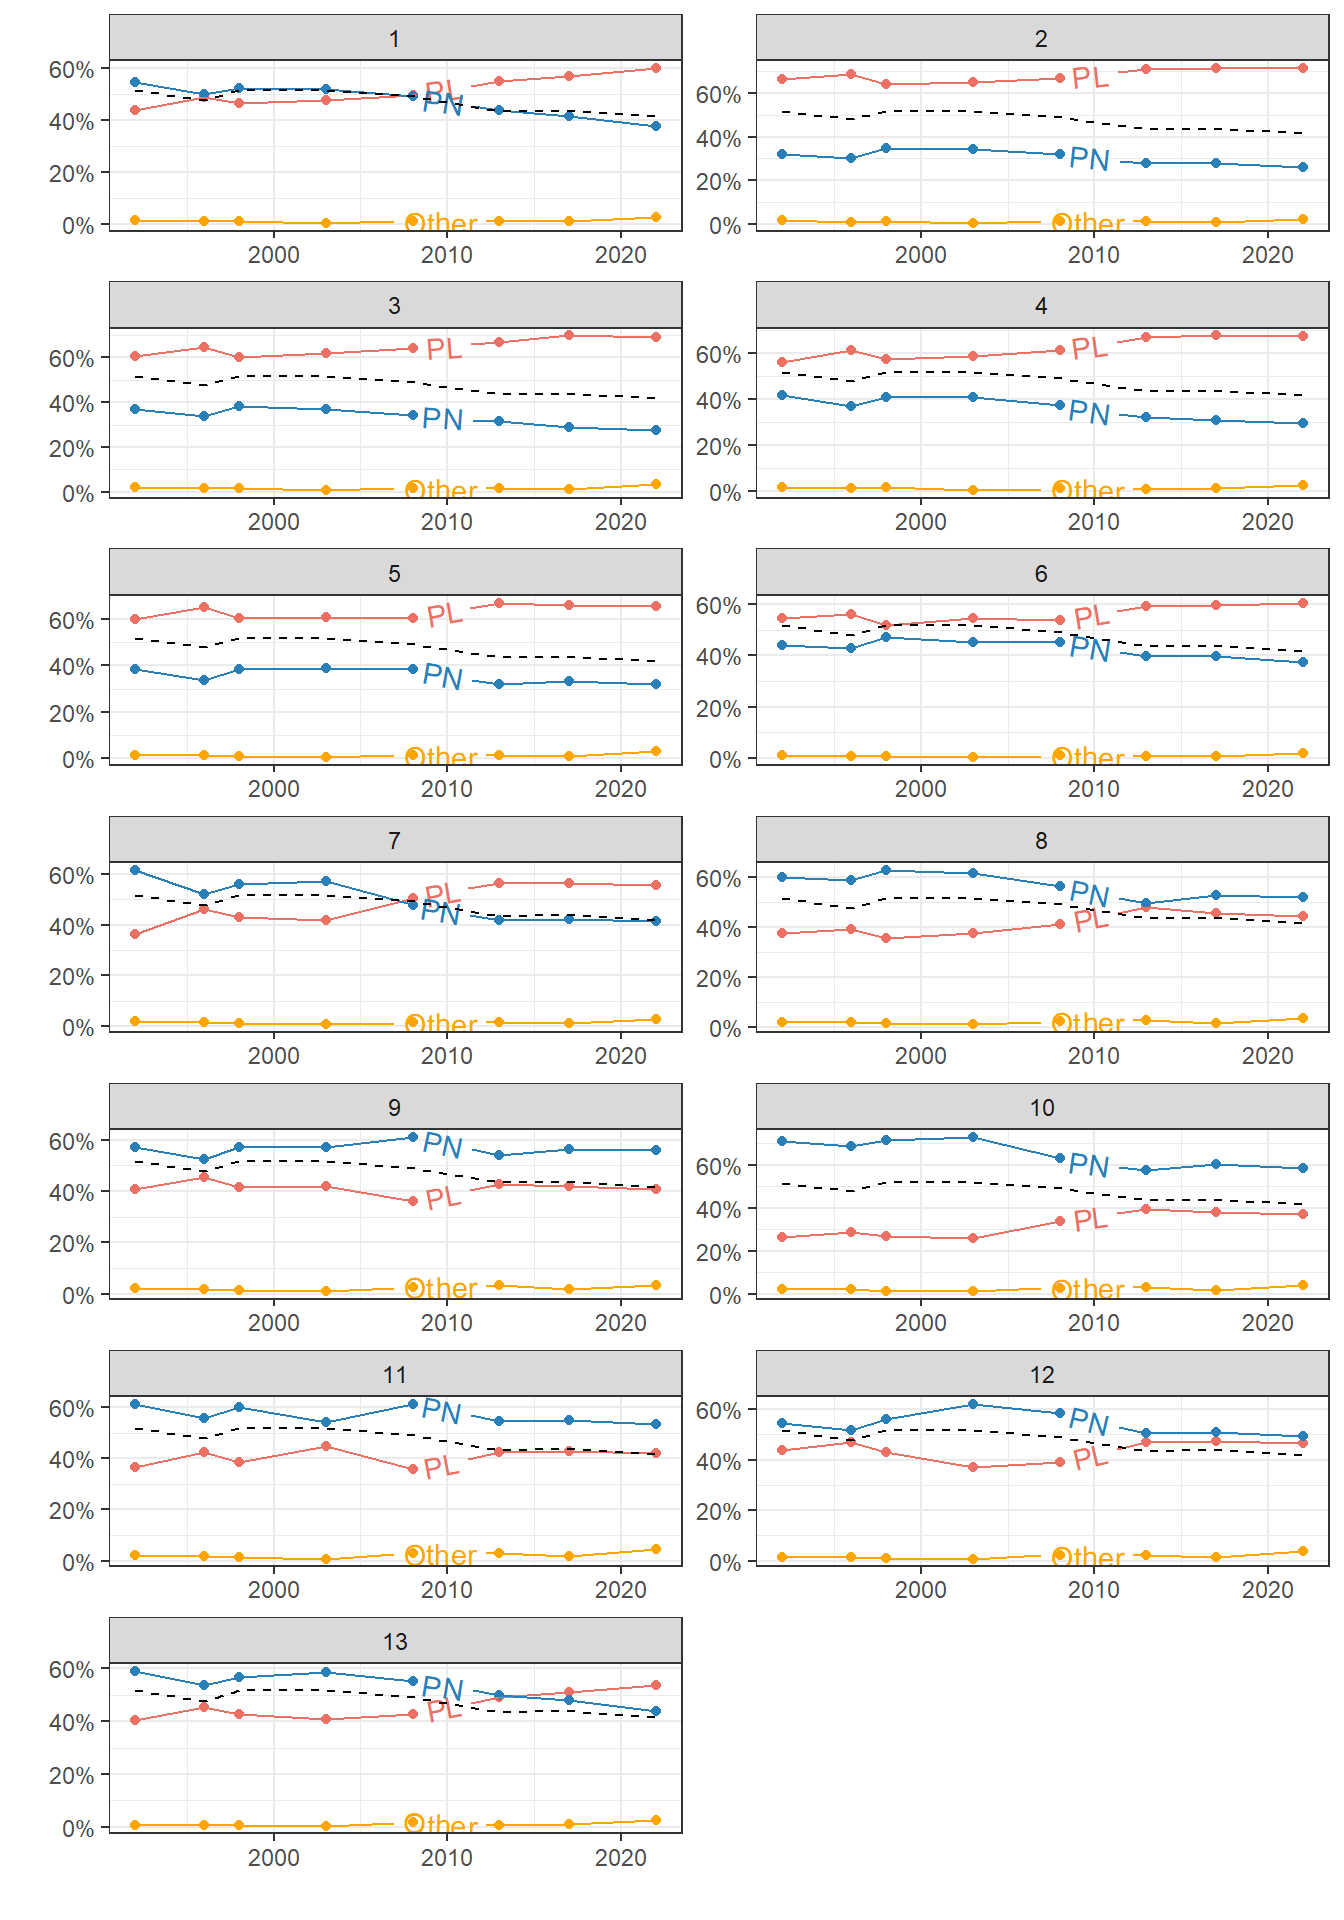
Districts 2-6 historically lean PL, while 8-12 lean PN. 1 and 13 are roughly a microcosm of the whole nation.
PL has been consistently performing better on its home turf while also making inroads in districts 11 and 12. A part of this may be internal migration, especially newer voters moving to district 12, but a more worrying chunk are people PL won over. This is also the majority of the shift in districts 1 and 13.
Adding to the PN’s woes is the fact that it’s without fail PN leaning districts that ‘try’ out alternative candidates but especially districts 9, 10 and 11.
Polling Error
Polling for this election was again fairly accurate, with practically all pollsters getting it ‘right’ in the last months of the campaigns. One way to visualise this is to plot the polls against the real election results (dashed line).
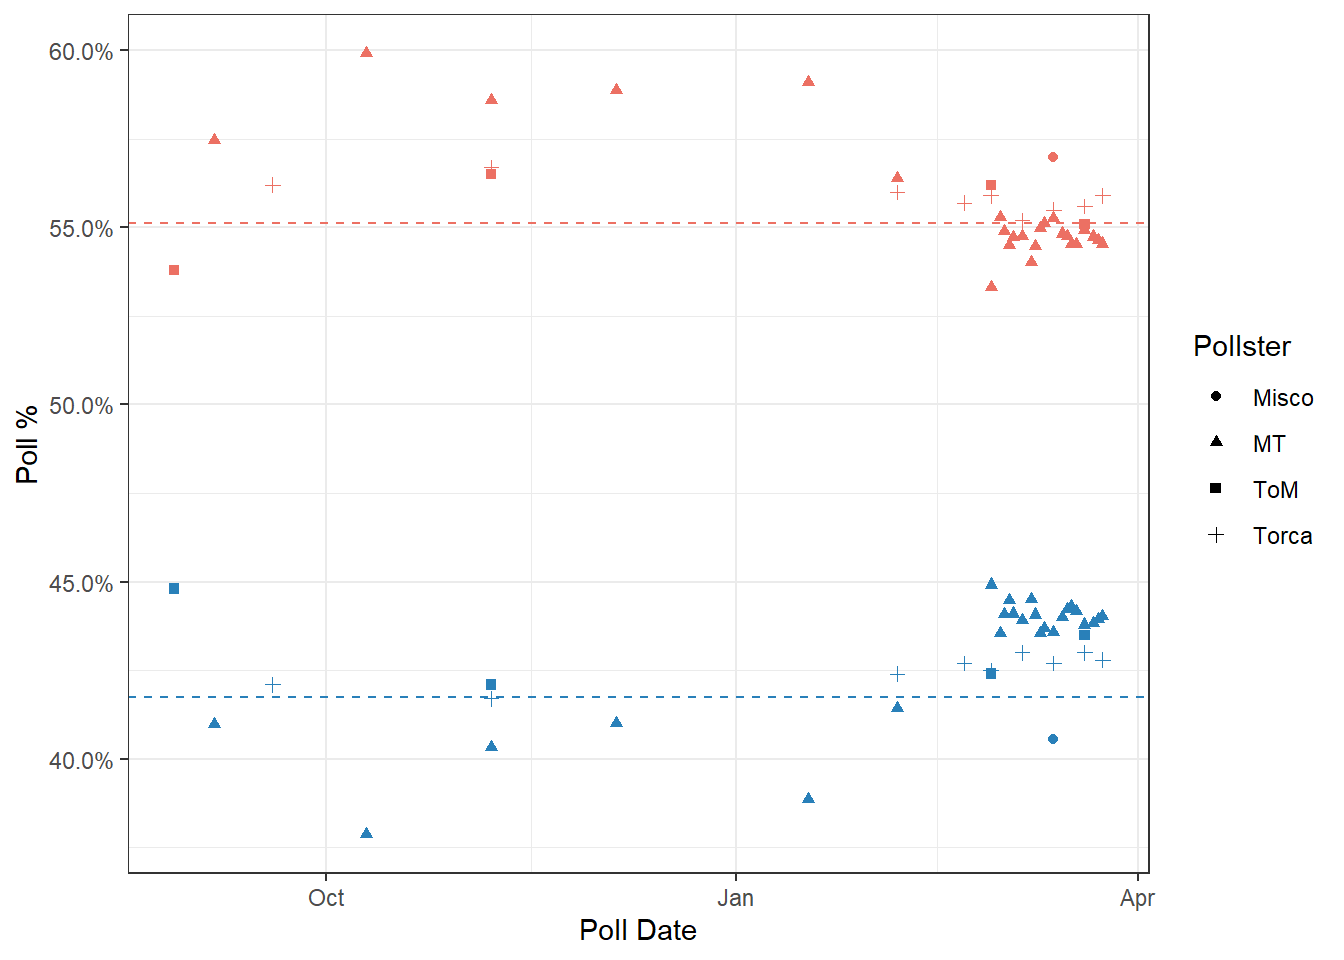
Another is to subtract the polled result from the election result and plot this absolute error over time like so:
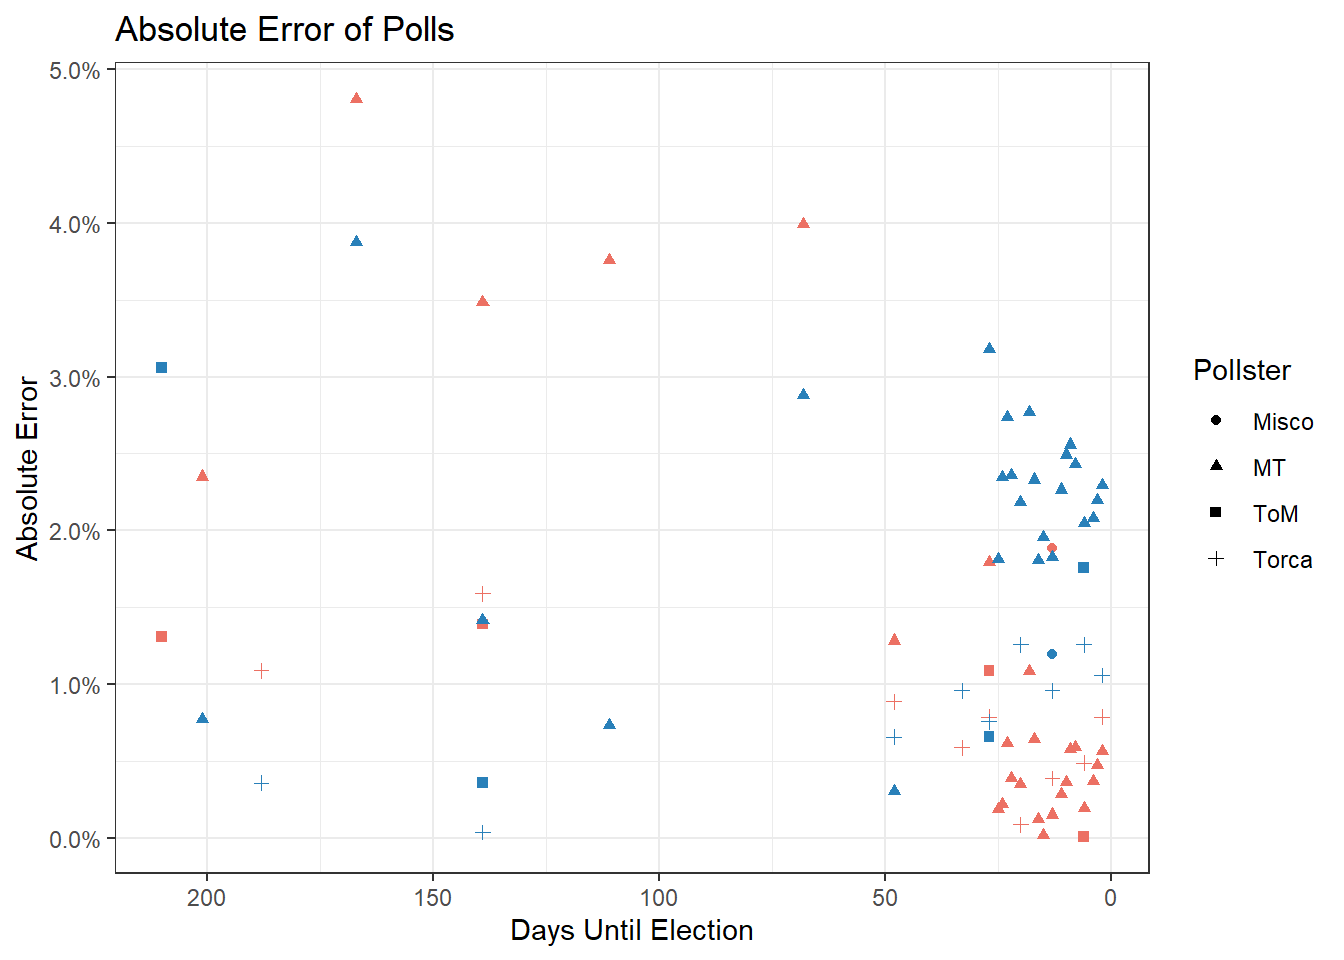
This is actually slightly more informative since it gives us the absolute errors public opinion mining incurs from reality, inclusive of things besides randomness, like the demeanor of the interviewer, the phrasing of the questions, the reachability of the electorate over the chosen channel etc.
What’s immediately clear is the extent to which PN under-performed it’s polls. Such a sustained error across pollsters and absent in the PL vote probably means that either PN didn’t manage to mobilize all its support on election day, or PN leaning voters chose other parties.
In any case, this is the third consecutive election for which we now have a sizable poll dataset, and our pollsters have been doing a pretty good consistent job:
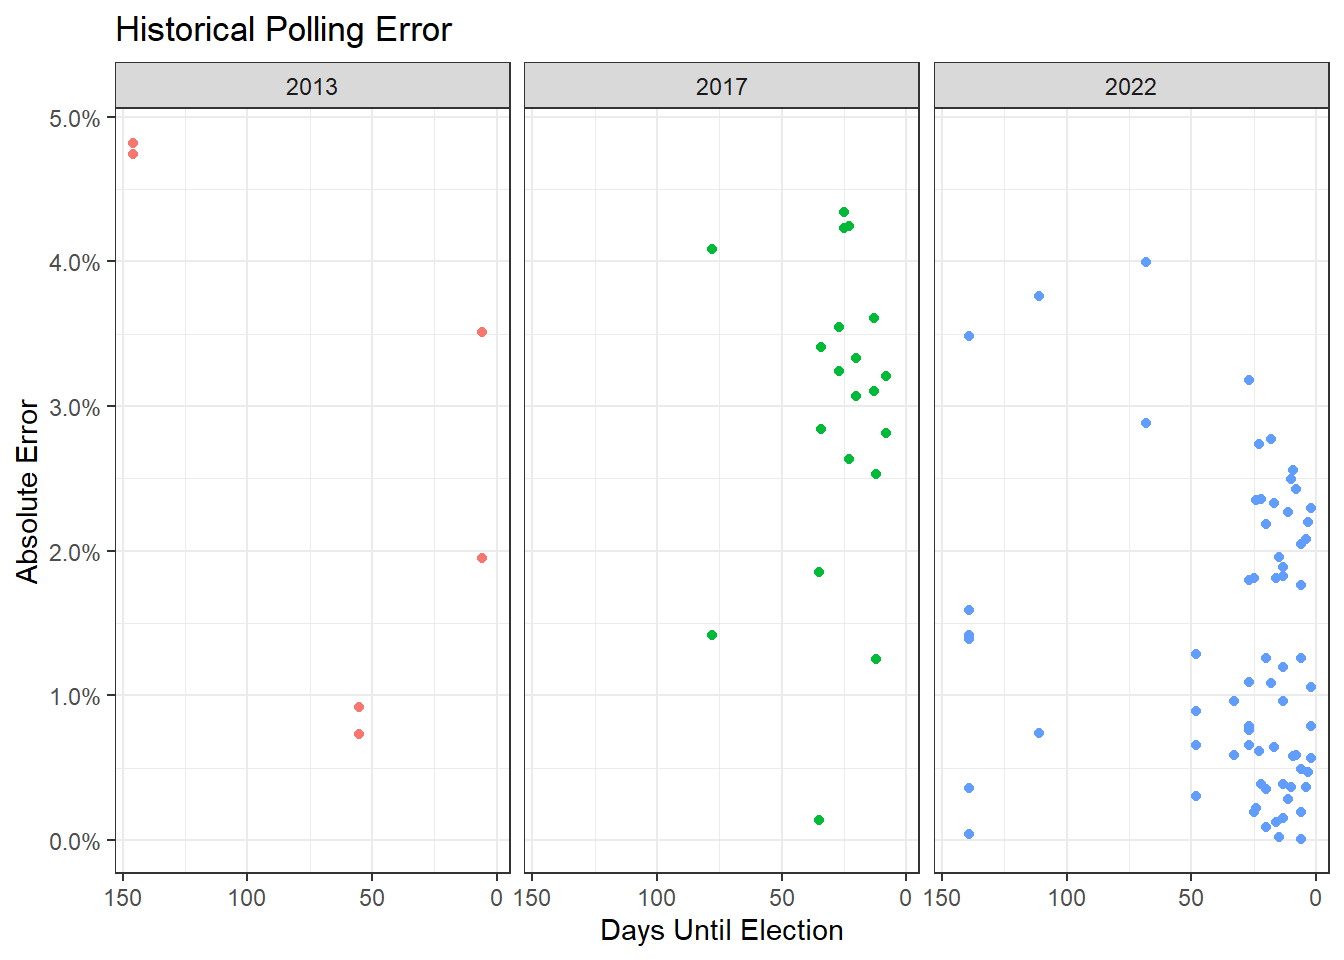
A few of them have faced some backlash for not reporting ‘votes’ correctly. While I think this is unfair, they were also the ones who humored people with this relatively uninformative metric in the first place.
The Electorate’s Support Shifts
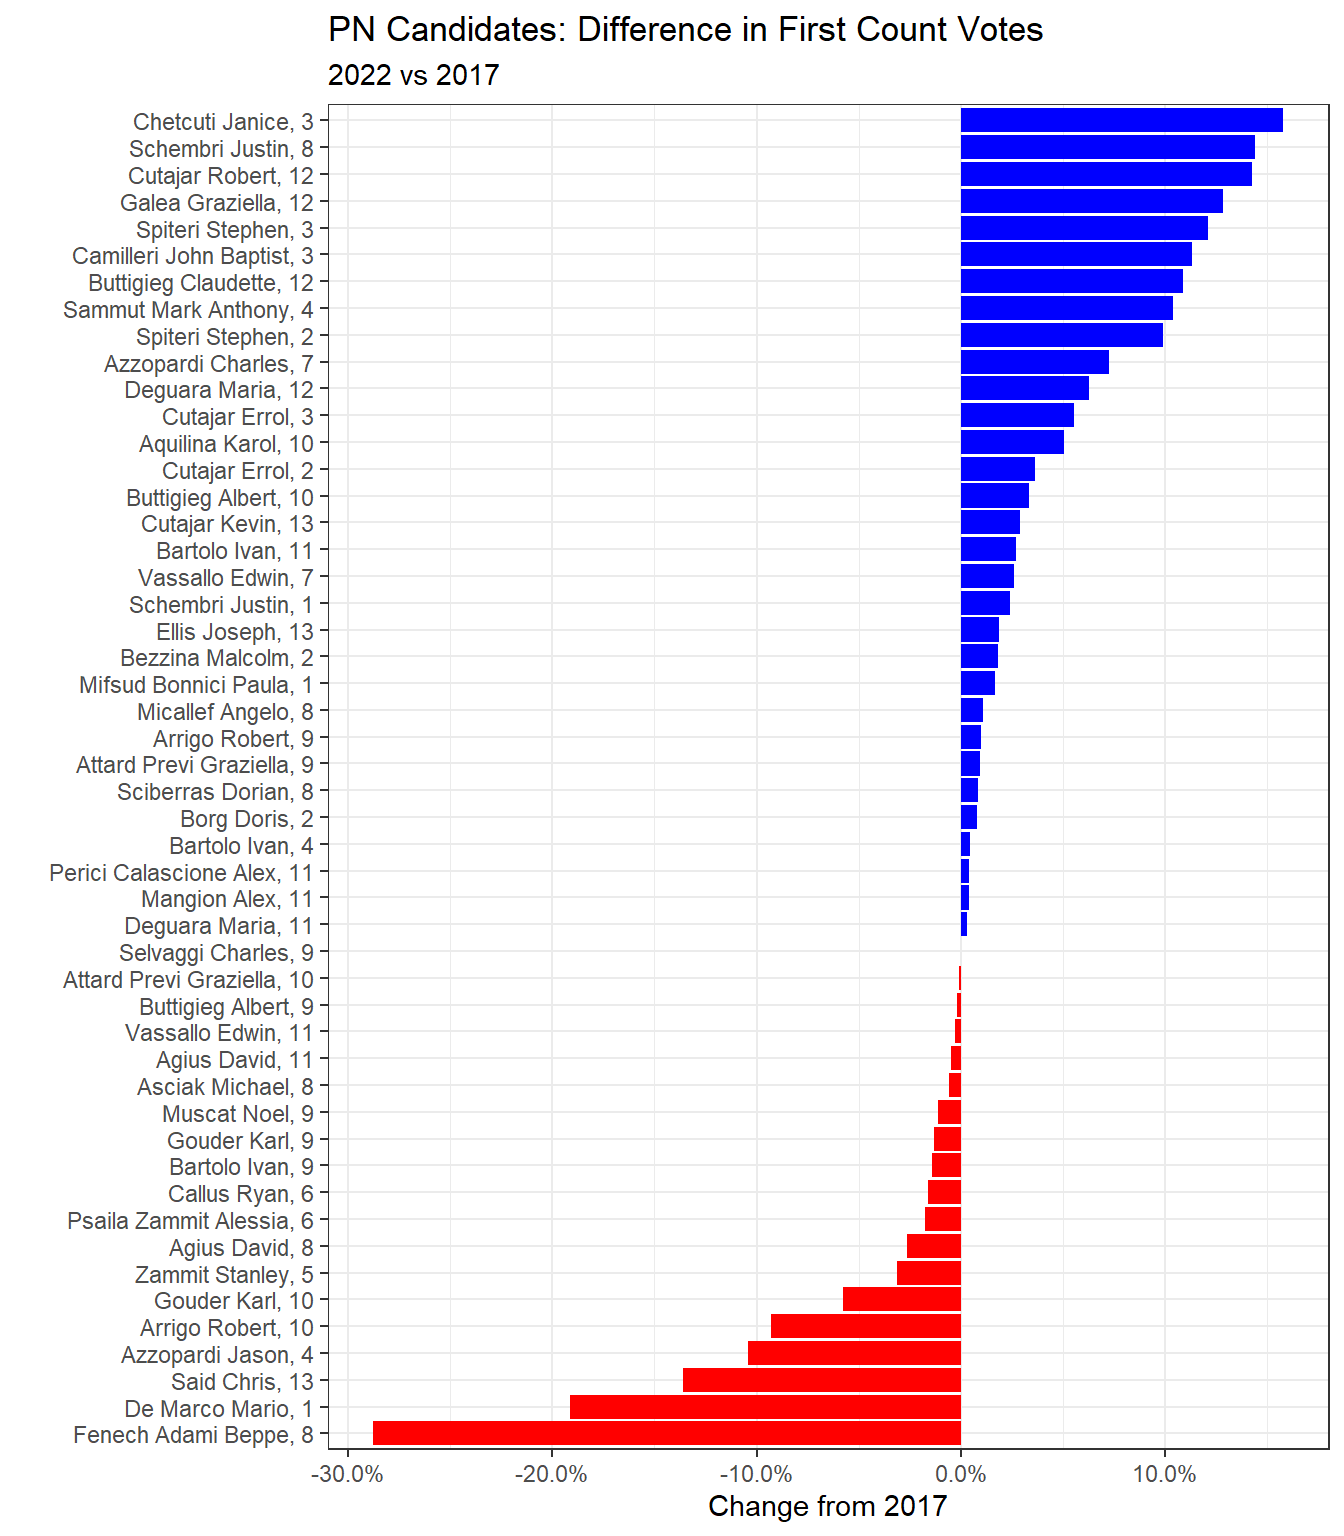
A mistake most political operatives also make is underestimate the agency of the average voter. Many voters do make conscious decisions for whom to vote and not to vote, it just may not be on the same basis as some expect.
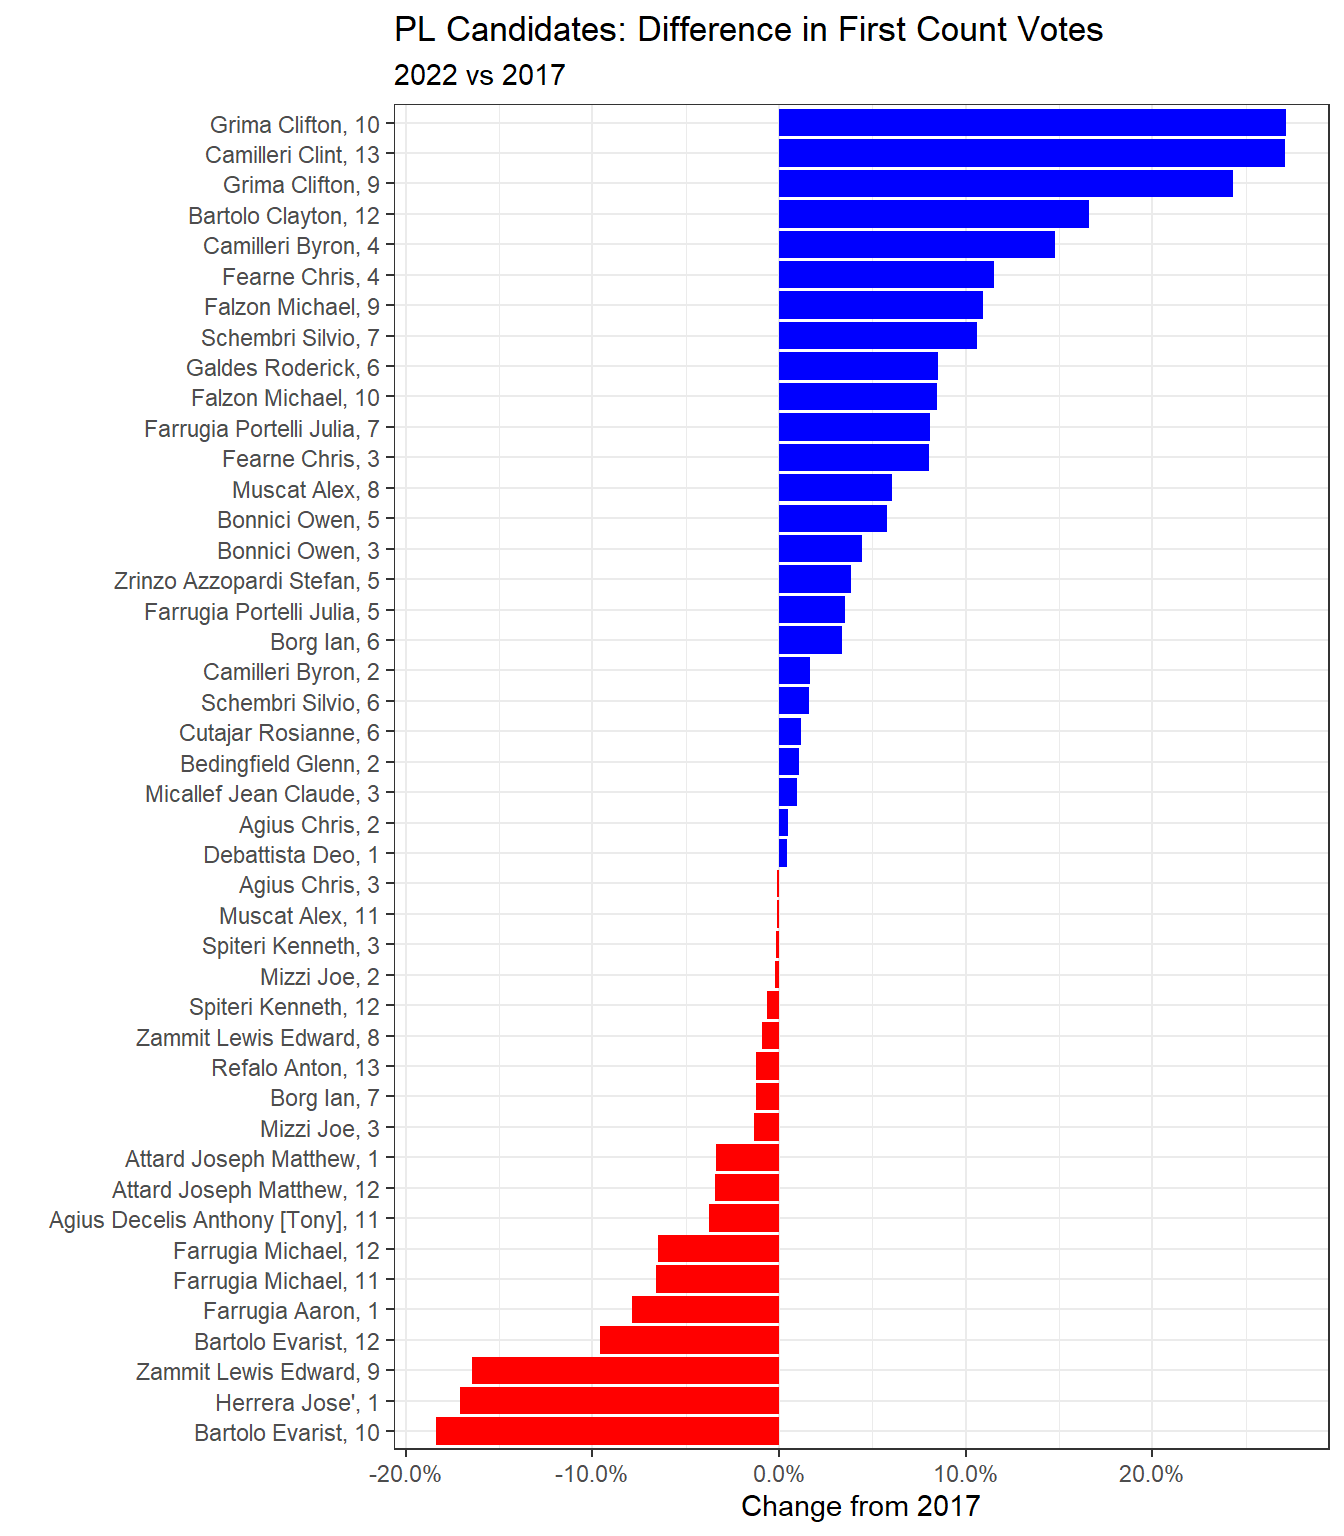
Take for instance candidates that ran both in 2017 and 2022. Some of them fared better, while others worse. The reasons are probably a bit beyond me in most cases, but I can imagine Zammit Lewis’s ‘gahan’ comments didn’t endear him to a large swathe of his electorate, while Chris Fearne’s handling of the pandemic was generally well received.
This also ties in to a more paradoxical point. A majority of Maltese say that corruption is a concern according to for example this study. 80% of Maltese say that the fight against corruption is very important to them (page 29) and 74% of them say that corruption is never justifiable (page 33).
Yet a number of MP’s with corruption scandals gained support, which means that either what defines corruption is misunderstood or that PN isn’t actually seen as the anti-corruption party despite their attempts to position themselves as so.
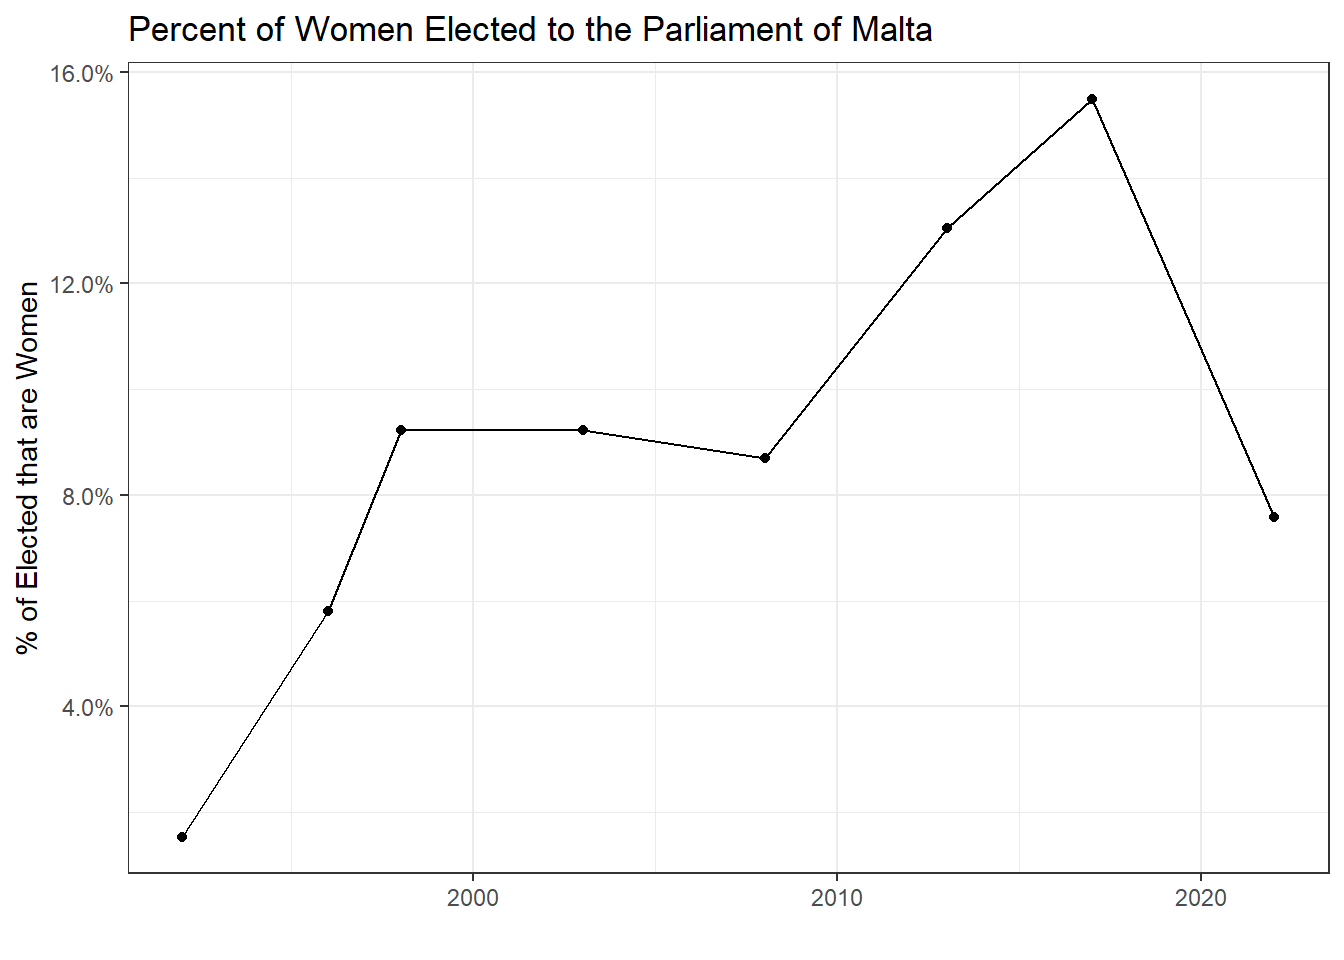
Did the Gender Quota misfire?
This parliament (prior the gender mechanism correction) is the least gender neutral since 1996’s. It might be a fluke, but it might also be the mechanism altering voting behavior, in which case, it’s the opposite of the intended outcome.
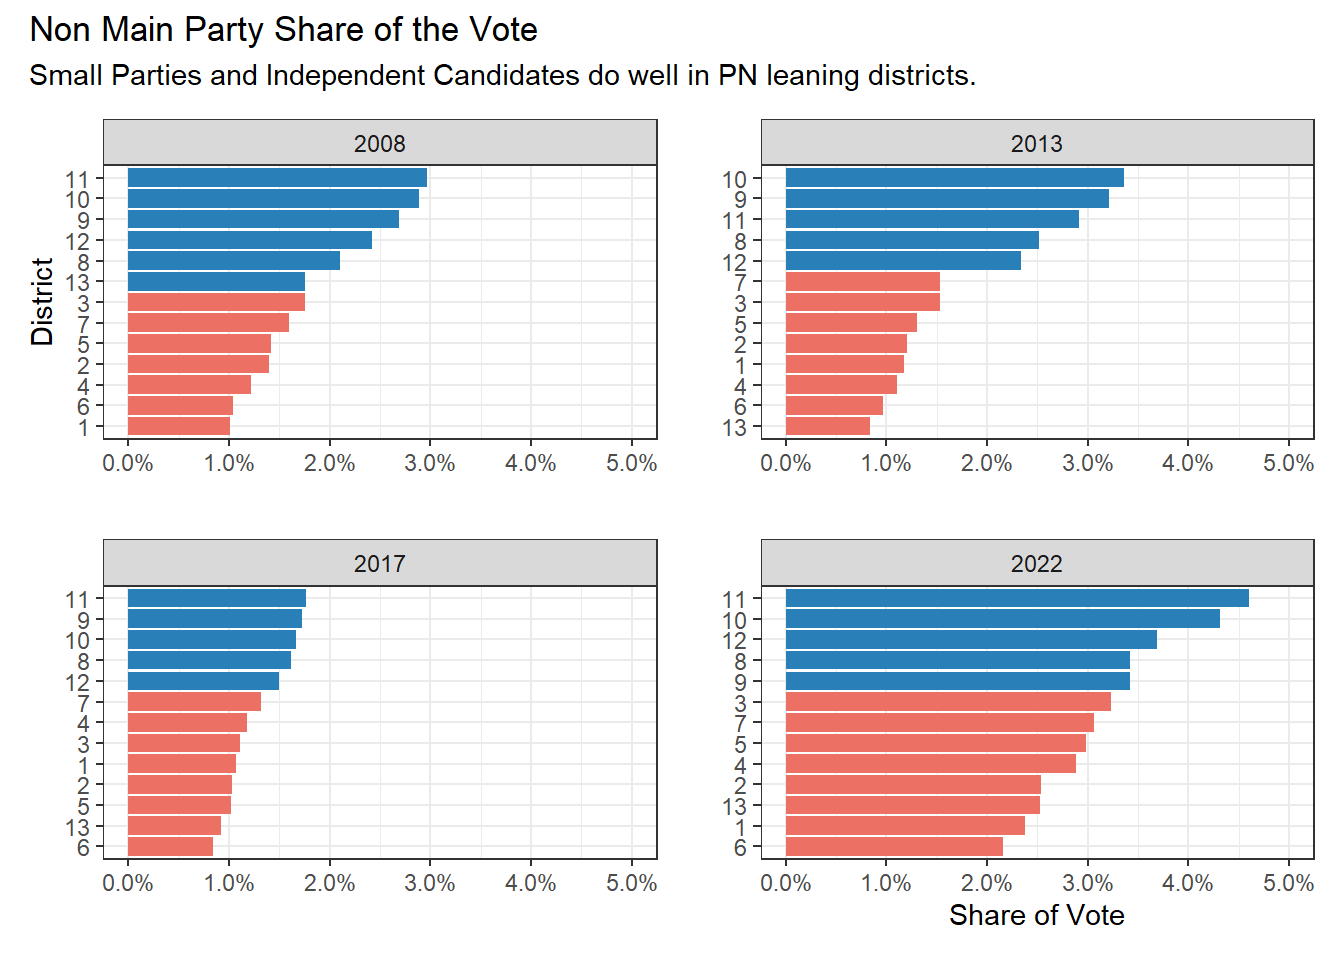
Small Parties
The picture here is a bit more complex. Third parties did do relatively well, but a breakdown by district shows that for example AD’s best results aren’t much better than their historic bests. In district 10, they had their worst showing ever while district 11 was their worst result since 2003. (The below is an interactive graph.)
This is an important tangent since those districts saw Arnold Cassola contesting as an independent for the first time. Cassola is tremendously well liked in those communities, and respected nationally. The success of his candidacy points to ‘green’ politics having a ceiling of less than 3% nationally. In practice it’s probably in the 1.5% range: any other votes AD attracts are protest votes of voters thoroughly annoyed with both the main parties.
The other side of this of course is that there are probably an equal portion of thoroughly annoyed voters who never vote AD because they are repelled by green politics.
How do Chits help parties sample elections?
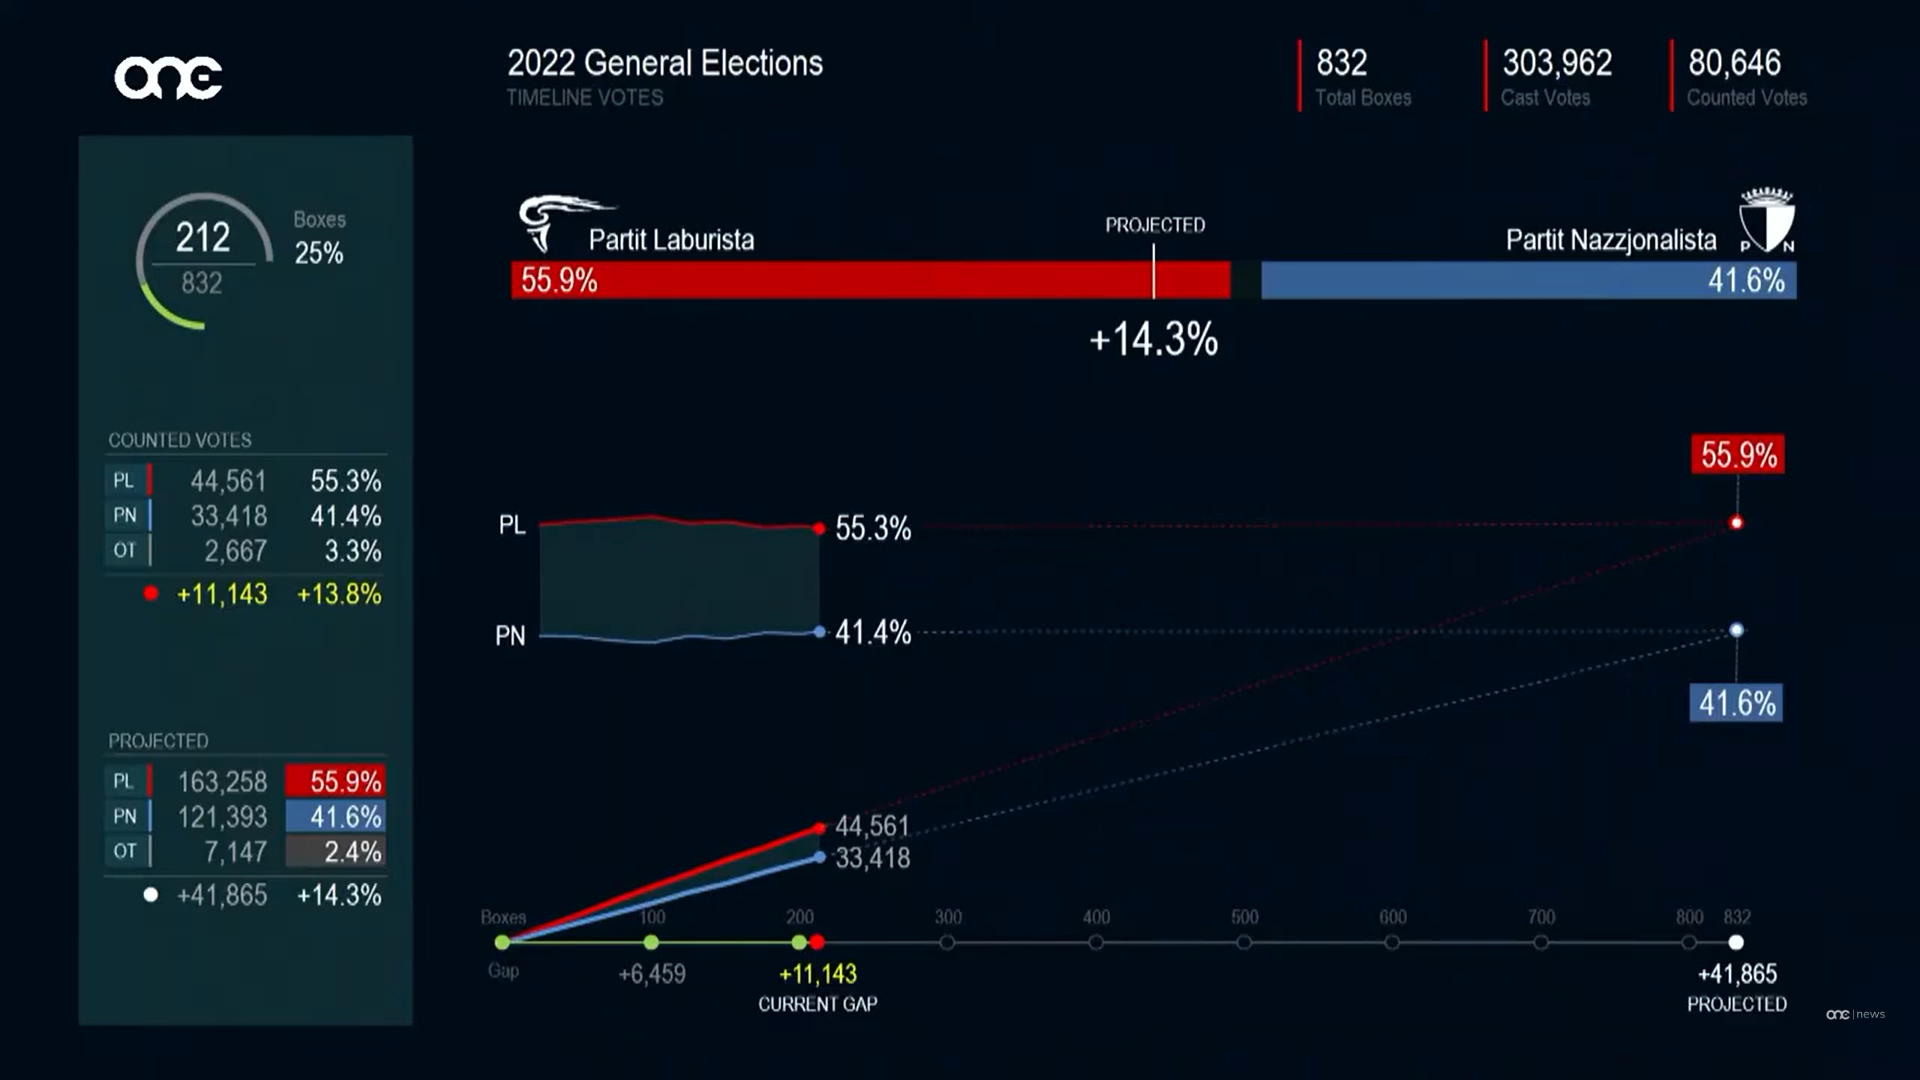
The official Electoral Commission result was only released by mid-day the following Monday. But PL called the win an hour after counting. It’s a peculiarity of Maltese elections is that unlike other countries where the press call the winner, in Malta, it’s the political parties themselves.
To do this they assign party agents to monitor every box and tally the 1’s on each vote. Here’s a great view of one of the chits in question (at the time of snapping, the sample is 23/30 votes PL, or 76%.)
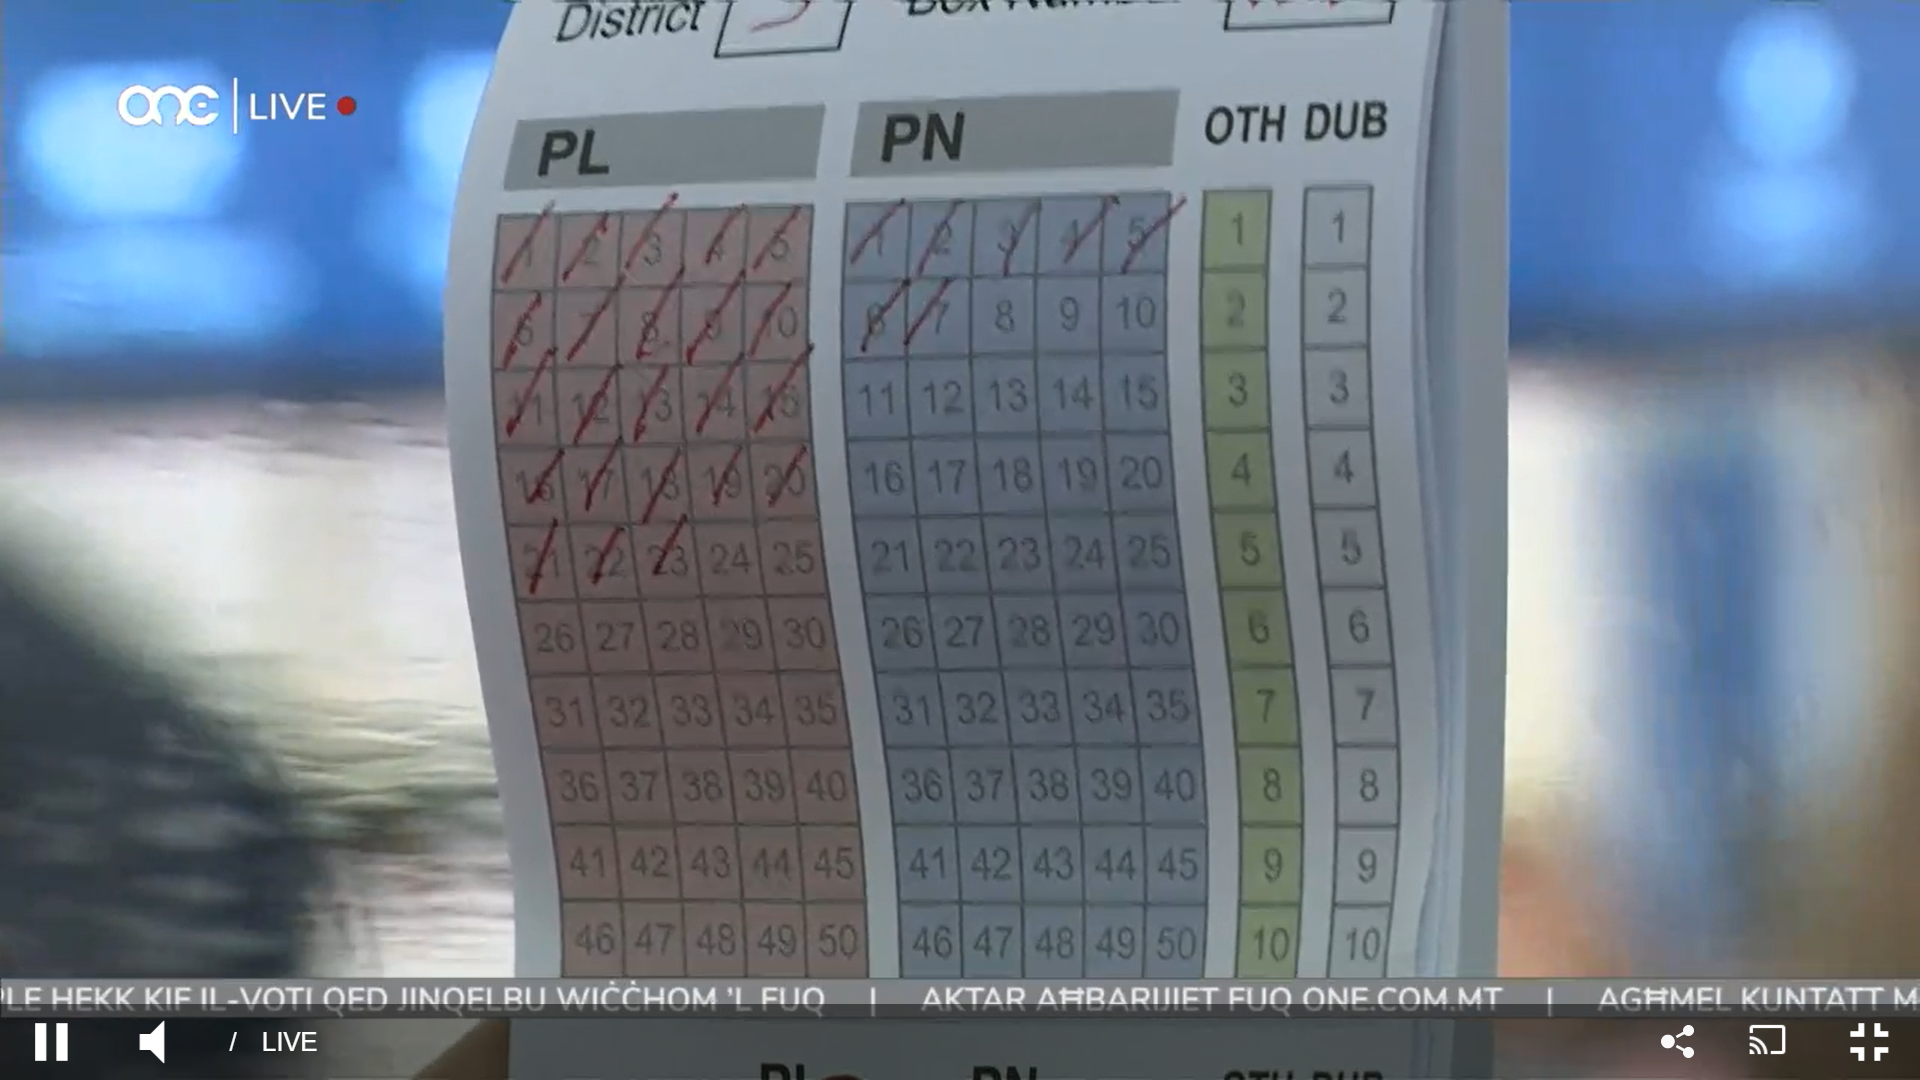
Each 100 vote chit is then passed on and the splits are pooled into a continuously growing sample. Since the sample is random, and counting for all districts is done at the same time, this approach is pretty sound inferential statistics, and as the sample grows, so does certainty.
Using the magic of R I simulated 4 scenarios below. The figure in the top of the box is the losing margin of the blue party, so the scenario gets progressively closer. The black dashed lines are also the subsequent ‘truths’ for each scenario. You can see as the sampling progresses and the pooled sample grows, the result converges towards the ‘true’ one.
The tighter the race is, the more variability in those early samples, which is why tight races might take more time to call.
#Create Vote proportions
proportions <- tibble(prop = c(0.4, 0.45, 0.48, 0.49))

#Generage 50,000 votes for each proportion
generate_pop <- function(prop){
  data <- sample(c('PN', 'PL'),
                 replace = TRUE,
                 size = 50000,
                 prob = c(prop, 1-prop)) %>%
    as_tibble()
  data <- data %>%
    mutate(proportion = prop,
           label_pretty = paste('True %:',
                                round(proportion * 100, 2)))
  return(data)
}

#Run the function
vote <- map(proportions$prop, generate_pop) %>%
  bind_rows()

#Create chit-ing function
sample_round <- function(chit_no){

d <- vote %>%
  group_by(proportion, label_pretty) %>%
  sample_n(100) %>%
  mutate(chit_no = chit_no)

return(d)}

#run 100 rounds of this
samples = data.frame()

for (i in 1:80){
  output = sample_round(chit_no = i)
  samples = rbind(samples, output)
}

#Modify it into a running tally (pool is always expanded)
tally <- data.frame()

for (i in 1:80){
  running_tally <- samples %>%
    filter(chit_no <=i) %>%
    group_by(proportion, label_pretty, value) %>%
    tally() %>%
    mutate(cnt = sum(n), prop = n/cnt, chit = i) %>%
    select(value, proportion, label_pretty, prop, chit, cnt)

  tally = rbind(tally, running_tally)
}

#Plot it

pop_true_pl <- vote %>%
  group_by(label_pretty) %>%
  summarise(pl_true = mean(value=='PL'))

pop_true_pn <- vote %>%
  group_by(label_pretty) %>%
  summarise(pn_true = mean(value=='PN'))

ggplot(tally, aes(y = prop, x = chit, color = value))+
  geom_hline(data = pop_true_pl, aes(yintercept = pl_true), alpha = 0.4, lty=2)+
  geom_hline(data = pop_true_pn, aes(yintercept = pn_true), alpha = 0.4, lty=2)+
  geom_point(alpha=0.7)+
  scale_y_continuous(labels = scales::percent)+
  theme_bw()+
  scale_color_manual(values = c('PL' = '#EC7063',
                                'PN' = '#2980B9'))+
    facet_wrap(~label_pretty)+
  xlab('Chit Number')+
  ylab('%')+
  theme(legend.position = "none")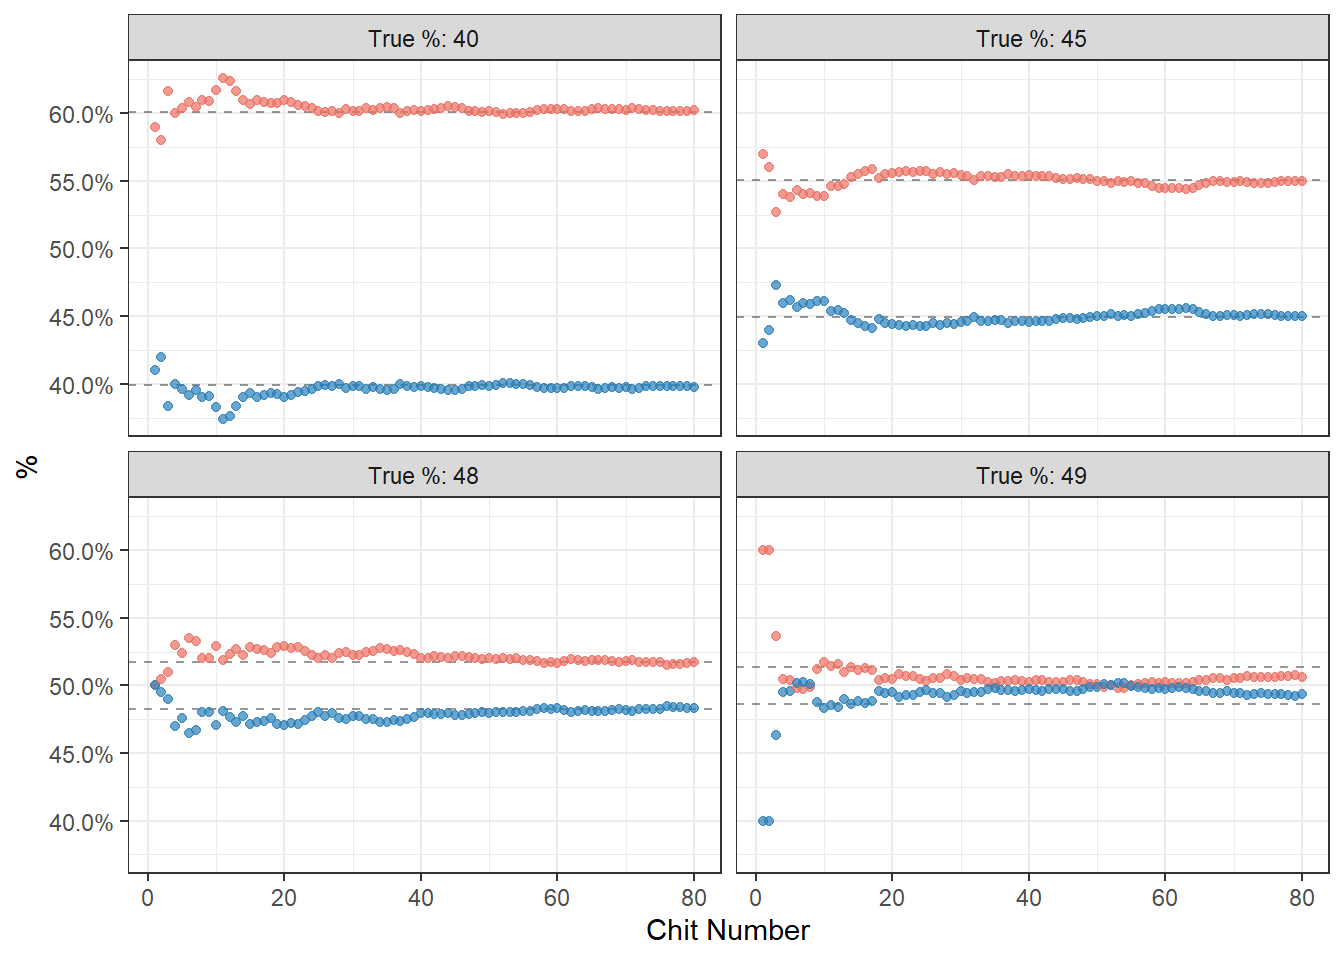
In fact, One/PL’s dashboard from election day shows a roughly analogous process to this: