The Great Silence
Unless you’ve been living under a rock, you know that Enemalta ran into… a slight hitch, when a wayward anchor severed a cable it was using to import around 200MW of electricity. In the candlelit silence that followed, attention shifted to the Electrogas operated Delimara 4 powerstation. Enemalta’s initial refusal to comment didn’t help, and as so often happens, facts die in a vacuum, and wild conspiracies take hold.
Some shared ominous insider information of out of order turbines that would take months to repair. Others said the tanker was nothing more than a prop, afloat and empty. The inherent complexities of power generation and distribution add to the noise and confusion. Save for a handful of engineers who work in the industry and rarely comment, it’s often one unfounded opinion versus another, so unless you have an impartial source, the truth might remain elusive. But this being 2020, data probably exists somewhere if we look hard enough.
To Thy Emissions Stay True
Electrogas have a pretty informative and interesting website. One page that particularly caught my eye was about emissions monitoring, probably to comply with some environmental directive. The Continuous Emissions Monitoring System keeps track of four emissions types across three chimneys. The Delimara 4 site is nothing more than three Siemens jet engines mounted horizontally. Each turbine provides 50MW of electricity. It’s the emissions of these turbines that we’ll be examining.

The Delimara 4 Site.
The assumption I’m making is that emissions are directly indicative of power generation when it comes to these three gas turbines. Another part of the system is a 60MW steam turbine powered by steam that’s generated from the heat of the first three turbines – this we have no way of gauging using this approach.
Now, Electrogas’s turbines burn LNG, which is relatively clean. In fact, according to General Electric, which manufactures its fair share of turbines: “particulate matter is generally considered negligible when burning natural gas. Thus, NOx and possibly CO are the only emissions of significance when combusting natural gas in combustion turbines.”
So now that we know for what to look, let’s import the data!
The data consists of hourly observations of milligrams of nitrogen oxide at each of the three chimneys. Each row is an hour. I added a fifth logical column called status, which codes “Off” if emissions are missing or 0 or “On” otherwise.
I imported two years of data, spanning from 4th of January 2018 to 23rd December 2019. Plotted out simply over time, we end up with the below time series.
“Where there’s smoke, there’s fire”
Now what we need to do to make sure our assumption holds water is check whether the readings show no emissions on days we know Delimara 4 tripped: November 26th 2019 and December 23rd 2019.
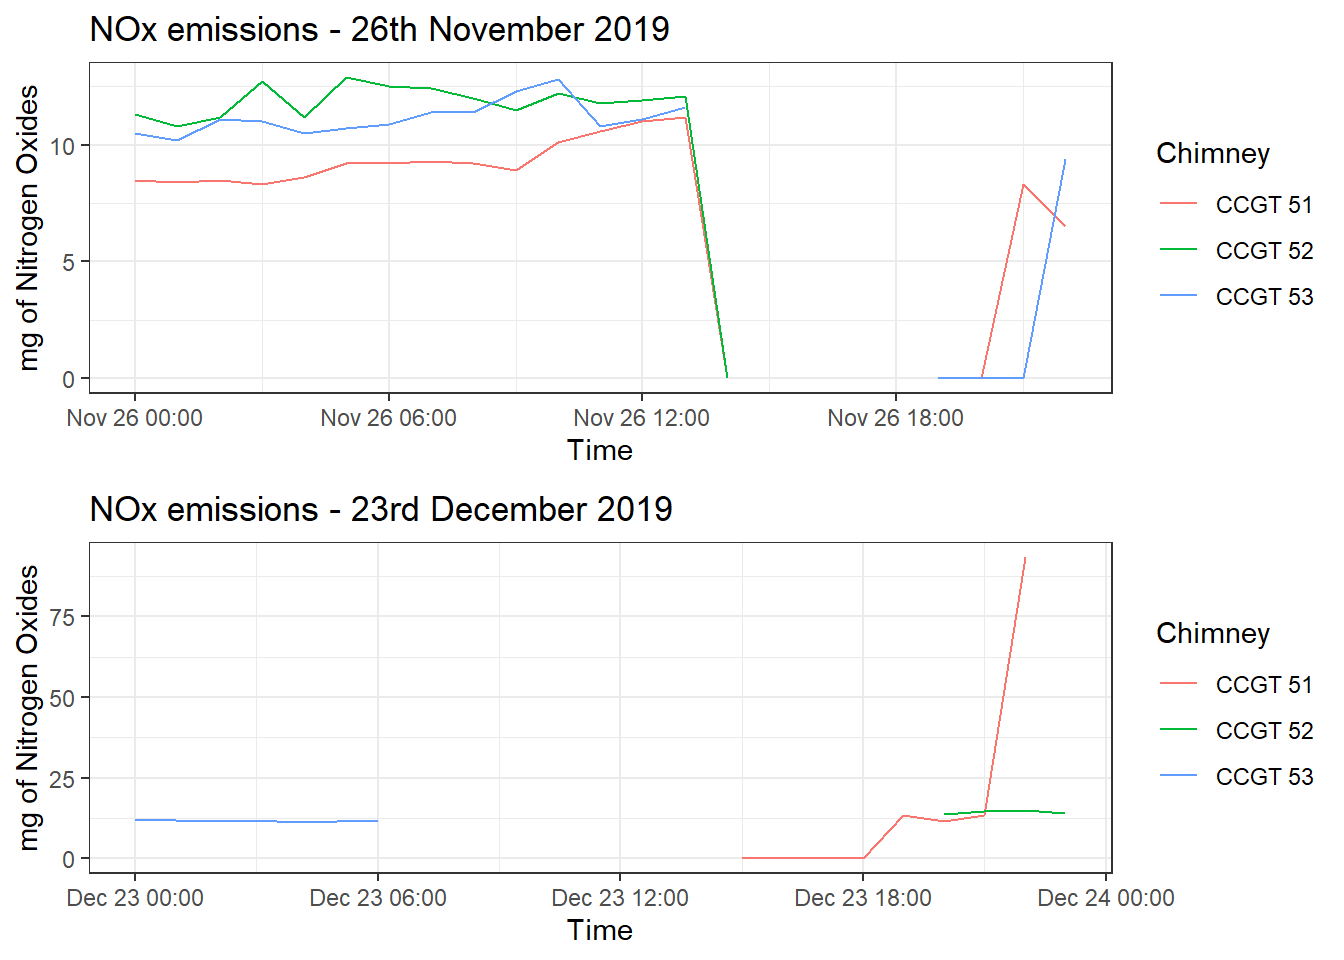
And sure enough, the assumption seems to hold water. On 26th November all three turbines were purring along before a fault in the interconnector forced a nationwide shutdown, while on 23rd December, only one turbine seemed to be on, before all three were restarted by evening.
This means we can go ahead and keep exploring the data. We can use our inferred status to plot how much a given turbine was on or off:
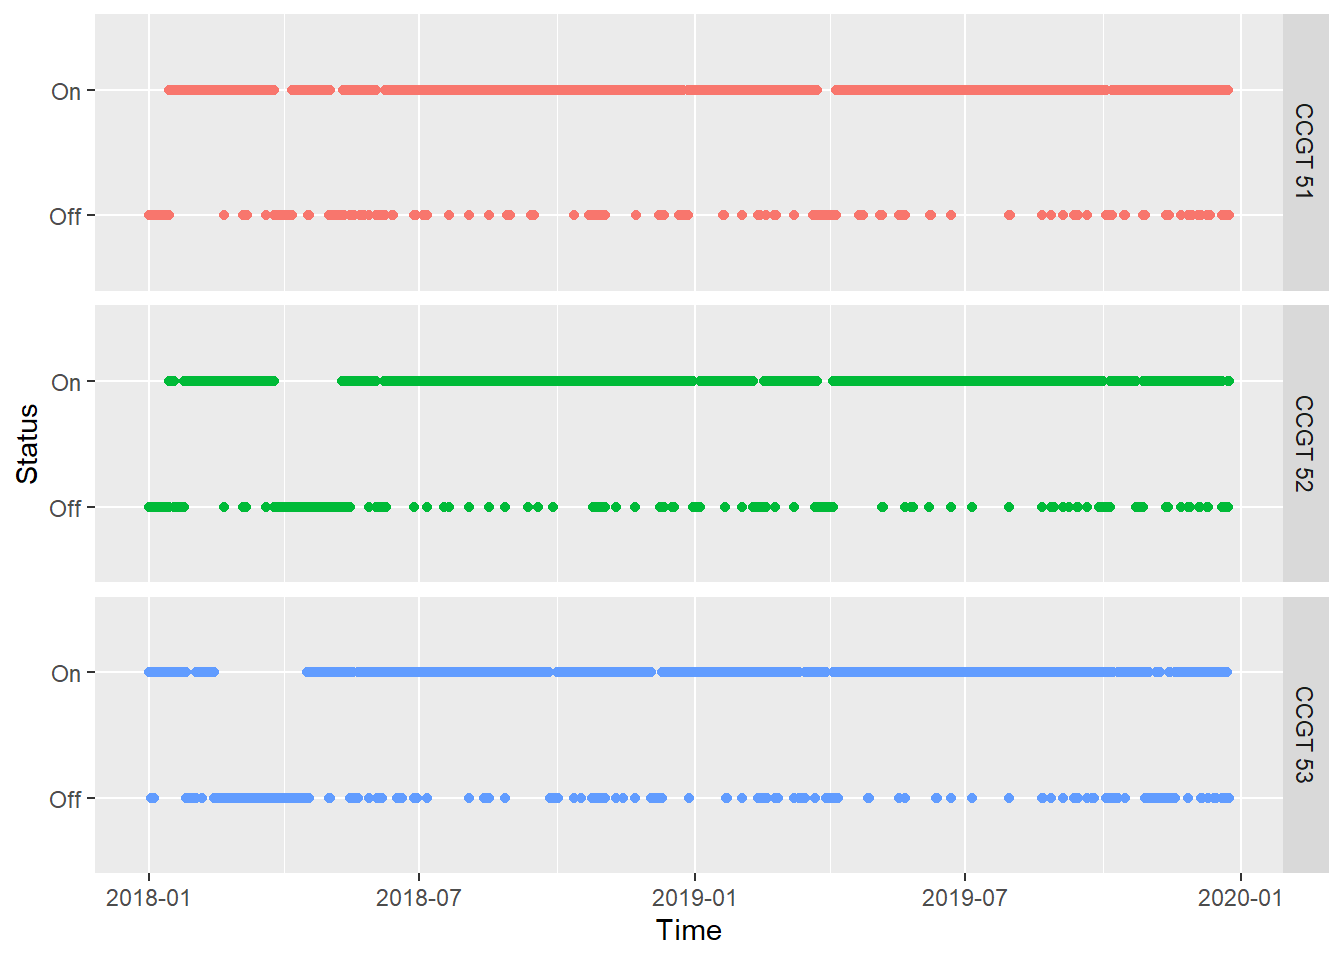
And all three turbines have been mostly on over the past two years. In fact, since each row is an hour, we can calculate the hours each turbine has been on or off.
On average, they have been on for around 85% of days since January 2018. Interestingly, a few hours have relatively high NOx emissions, and they always seem to occur in the first hour a turbine is switched on. After a bit of digging, I came across this paper which indicates that NOx emissions during startup are much higher than those in normal operations because an adequate minimal temperature needs to be reached before the selective catalytic reduction system can be switched on. SCR breaks down the NOx into water.
This gave me another idea. We can also try to infer the number of starts of each turbine by counting how many times NOx emissions exceeded what we’d see on average. We can see the average by plotting a density graph, or by using a statistical summary.
ggplot(chimney_cems, aes(mg, fill = Chimney))+
  geom_density()+
  theme_bw()+
  labs(title = "Distribution of NOx emissions") +
  xlab("mg of Nitrogen Oxides")+
  ylab("Density")
## Warning: Removed 8099 rows containing non-finite values (stat_density).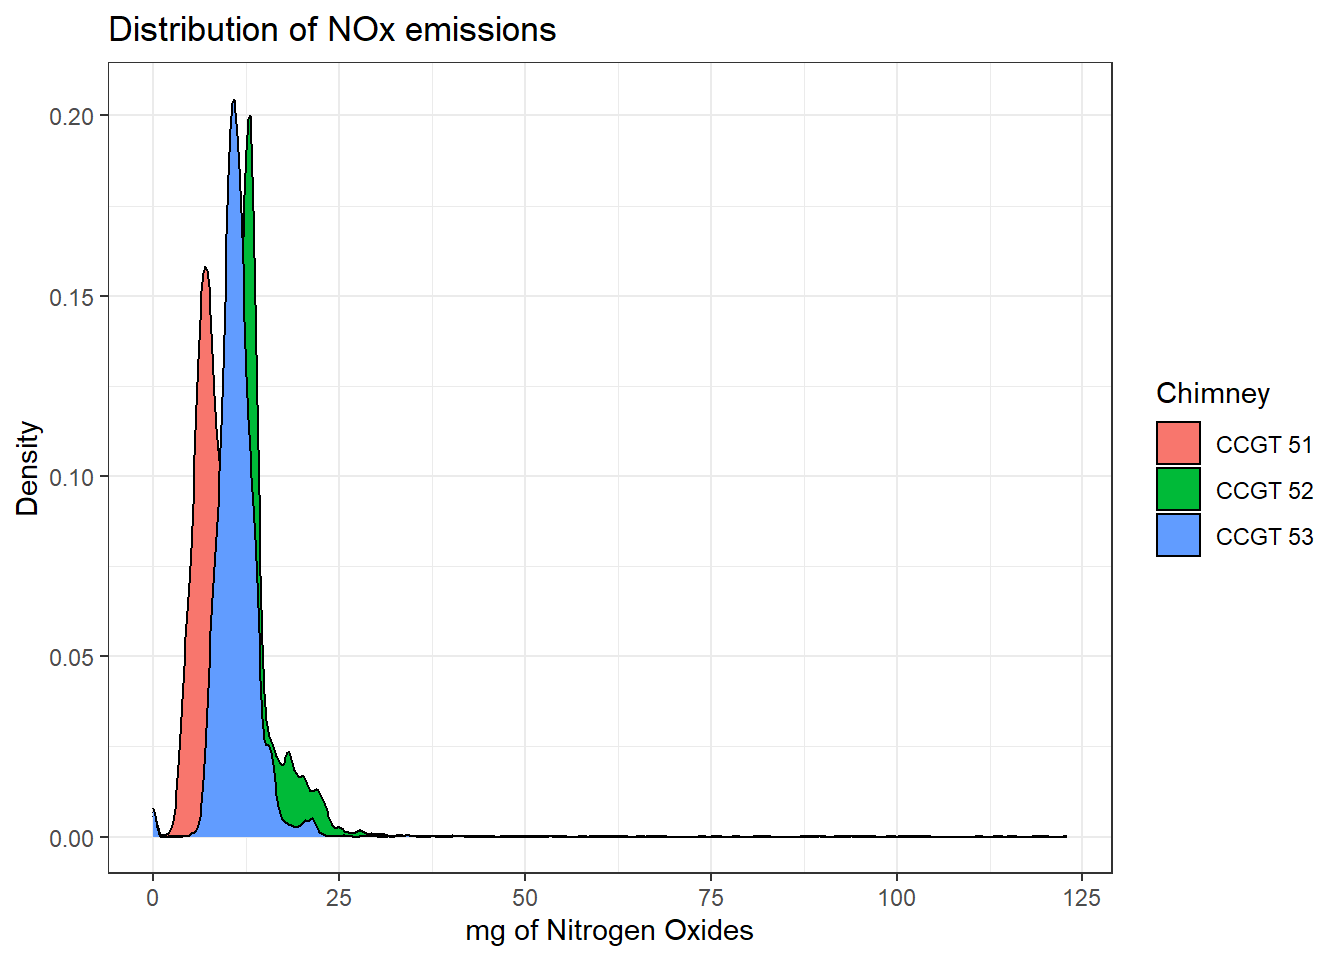
summary(chimney_cems$mg)## Min. 1st Qu. Median Mean 3rd Qu. Max. NA's
## 0.00 8.60 10.80 10.92 12.60 122.80 8099Since this is probably verging on the “out there”, let’s go for a conservative value well above the thrid quartile, and define anyhing greater than 25mg of NOx as a possible “start”.
chimney_cems %>%
  filter(mg >= 25) %>%
  group_by(Chimney) %>%
  tally()
## # A tibble: 3 x 2
## Chimney n
## <chr> <int>
## 1 CCGT 51 41
## 2 CCGT 52 159
## 3 CCGT 53 44“Let there be light”
Oddly enough, the last day you can get emissions data is after that start on December 23rd. Why exactly it stopped being released I don’t know. But we can say that if emissions are anything to go by, Delimara 4 has been working for some time.
On a semi related vein, publicly available data, especially when used in creative ways to answer current questions can be a powerful addition to traditional journalism. Demand it from your news outlets that you get this sort of journalism day in, day out.
P.S. If you’re interested in learning more on how Electrogas generates electricity, this overview by Siemens is a gentle introduction: