Whole Survey Margin of Errors Break Down in Subgroups
Some casual MaltaToday readers were in a flurry over the past month and a half over the possibility that PN had not only made a sizeable dent in Labour’s lead in the 13th electoral district, but carried it completely.
A new survey in early December subsequently wrote off the gains, but disappointingly seemed to play in to the narrative of a dynamic race. The actuality of what happened is probably much more boring, and covered in the final section of MT’s own methodology section:
Stratified random sampling based on region, age and gender was used to replicate the Maltese demographic. The estimated margin of error is 4.8% for a confidence interval of 95% for the overall results. Demographic and sub-group breakdowns have significantly larger margins of error.
You see, typically, around 600 people are surveyed for polls like this. That’s a fairly decent number, and traditional statistics tells us that 95 times out of a 100, we’ll capture a number (PL’s support for instance) that is +/- 4.8% what that number actually is in reality.
The trouble comes when looking at the group splits. Gozo for example has roughly 1/13th the voting population – circa 8%. If the sample is stratified perfectly, 8% of the 600 surveyed people would be Gozitans. So the opinion of 64 people forms that subgroup.
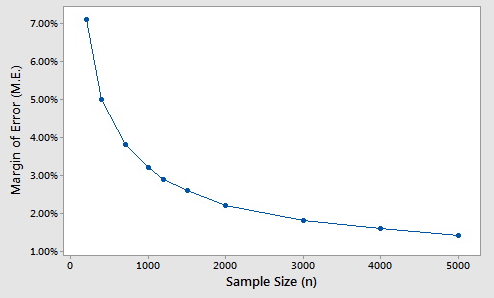
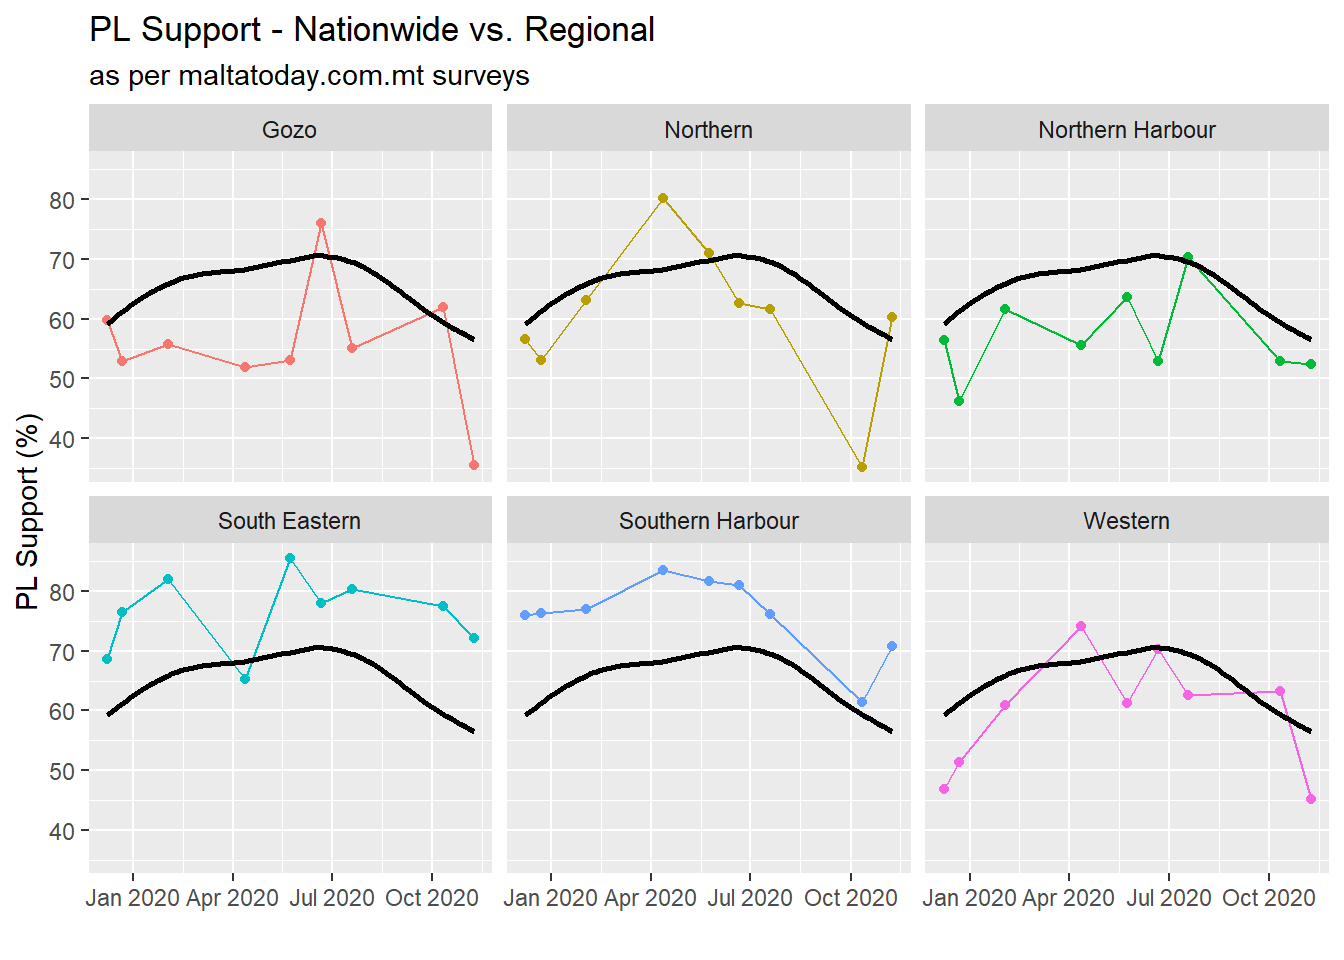
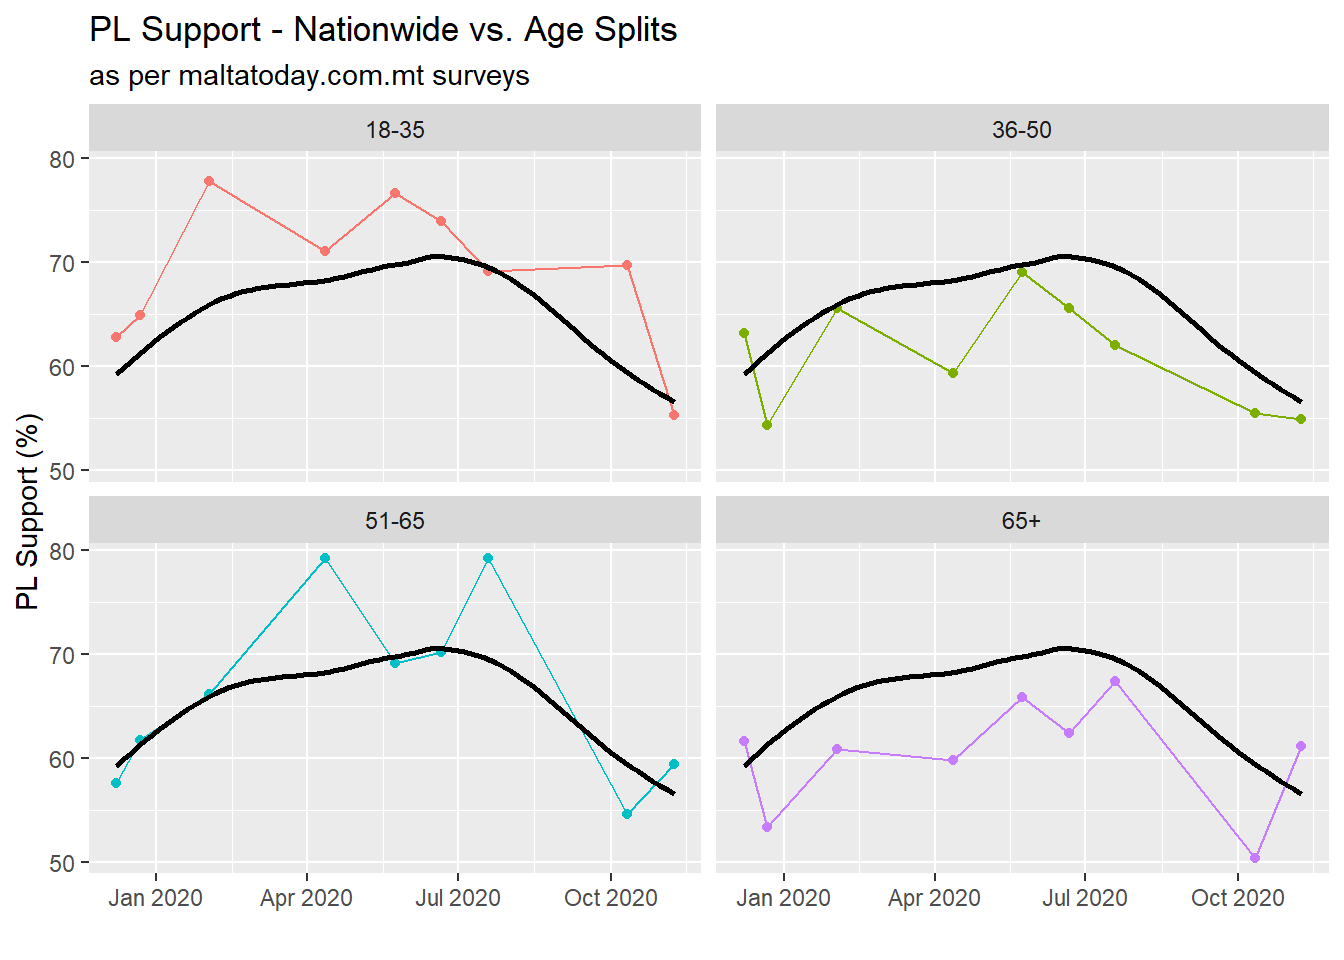
The margin of error decreases at the square root of the sample size – which means it’s pretty big to begin with. All of this points to those subgroup statistics as rather noisy. In fact, I collected the age and region splits for all MT surveys thus far in 2020, and plotted them next to the nationwide support. The difference in variability is immediately evident.
Intuitively, this phenomenon makes sense. By dampening it with less people, you’re allowing random chance to swing your measurement up and down by a greater margin. It is also the reason why in contexts where subgroups are very important (say a clinical trial for a new medication), steps to ensure the statistical power of each subgroup are taken (often recruit tons of people).
Using Bootstrapping to Estimate the Margin of Error in Gozo
Looking at the first chart included, you can sort of eyeball that a margin of error for a sample of 60 people would certainly be above 10%. But using bootstrapping, we can estimate it from the observed data. What follows comes with one major caveat: I’m completely discarding the effect of time in PL support over 2020. This is almost certainly wrong, but I’m going to still do it because 1) this race has remained relatively stable and 2) I want to plot more graphs.
Bootstrapping allows us to use our tiny dataset to build up a theoretical population. This helps us understand the variability observed due to sampling. So the first thing I do is pull out the 9 points for PL support in 2020 into a vector. This literally corresponds to reading the Gozo graph from right to left.
## [1] 35.45918 61.96682 55.06884 75.97841 53.10520 51.82796 55.70698 52.95815
## [9] 59.83607
Now we set up the bootstrap, sampling with replacment 9 times, and calculating a mean of this sample. We repeat this 10,000 times.
set.seed(123)
sims <- replicate(n = 10000,
          expr = {
            Gozo %>%
              sample(size = length(Gozo), replace = TRUE) %>%
              mean()
          })
We can plot out the distribution of PL support across all 10,000 simulations as a histogram:
GozoBootstrap <- sims %>%
  as_tibble() %>%
  ggplot(aes(x=value))+
  geom_histogram(bins = 70)+
  labs(title = "Bootstrap Distribution of PL Support in Gozo")+
  ylab("Count of Simulations")+
  xlab("PL Support (%)")
GozoBootstrap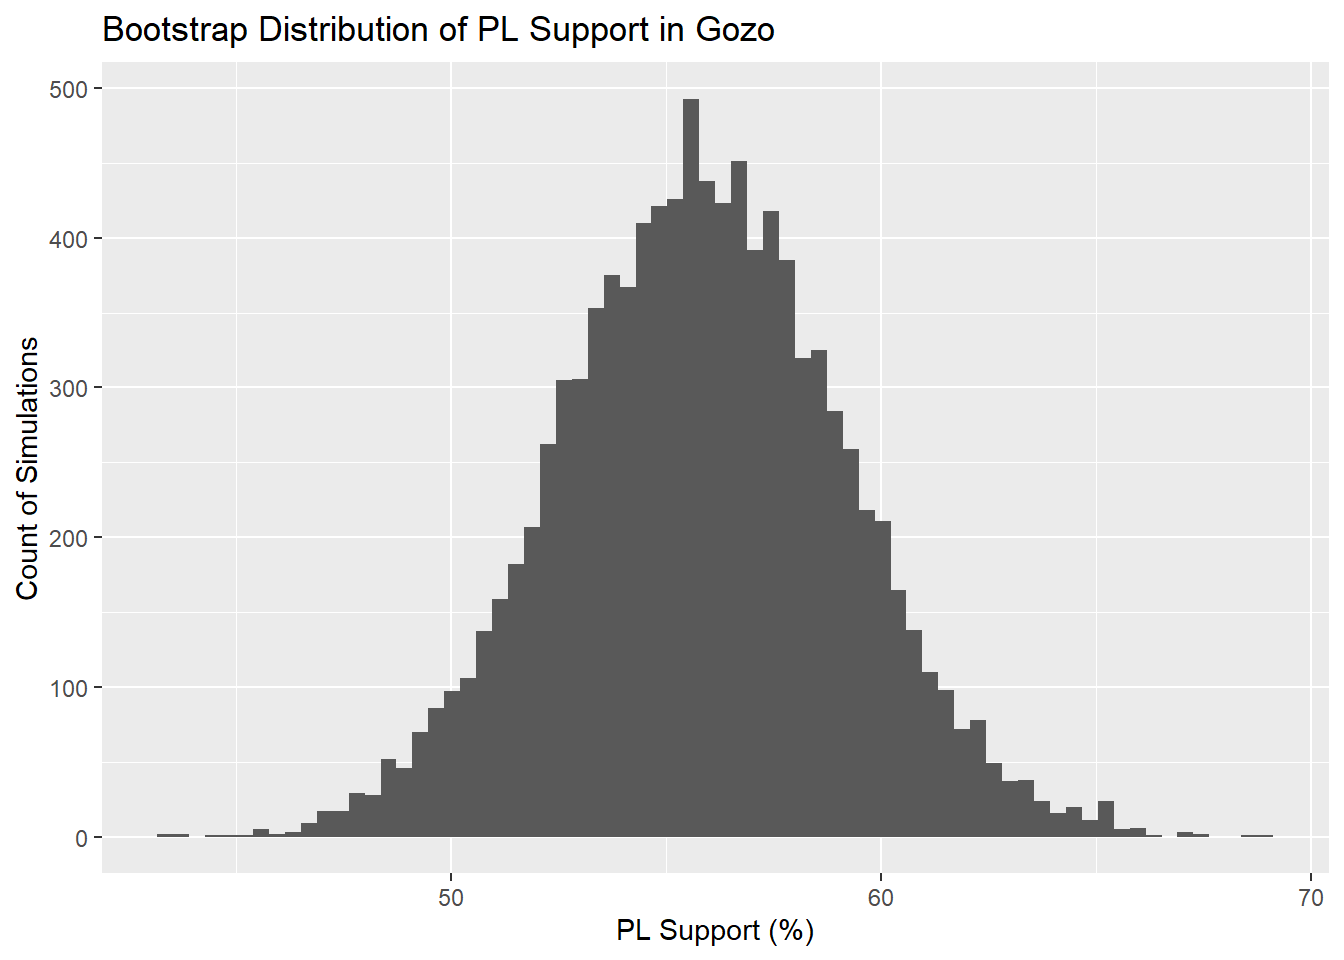
Now, the bootstrapped mean will always be pretty close to the sample mean, so we’re not gaining any additional insight here in that regard, but since we have a distribution, estimating the 95% confidence interval is as easy as using the quantile function…
lower = quantile(sims, 0.025)
upper = quantile(sims, 0.975)

upper
## 97.5%
## 62.39586lower## 2.5%
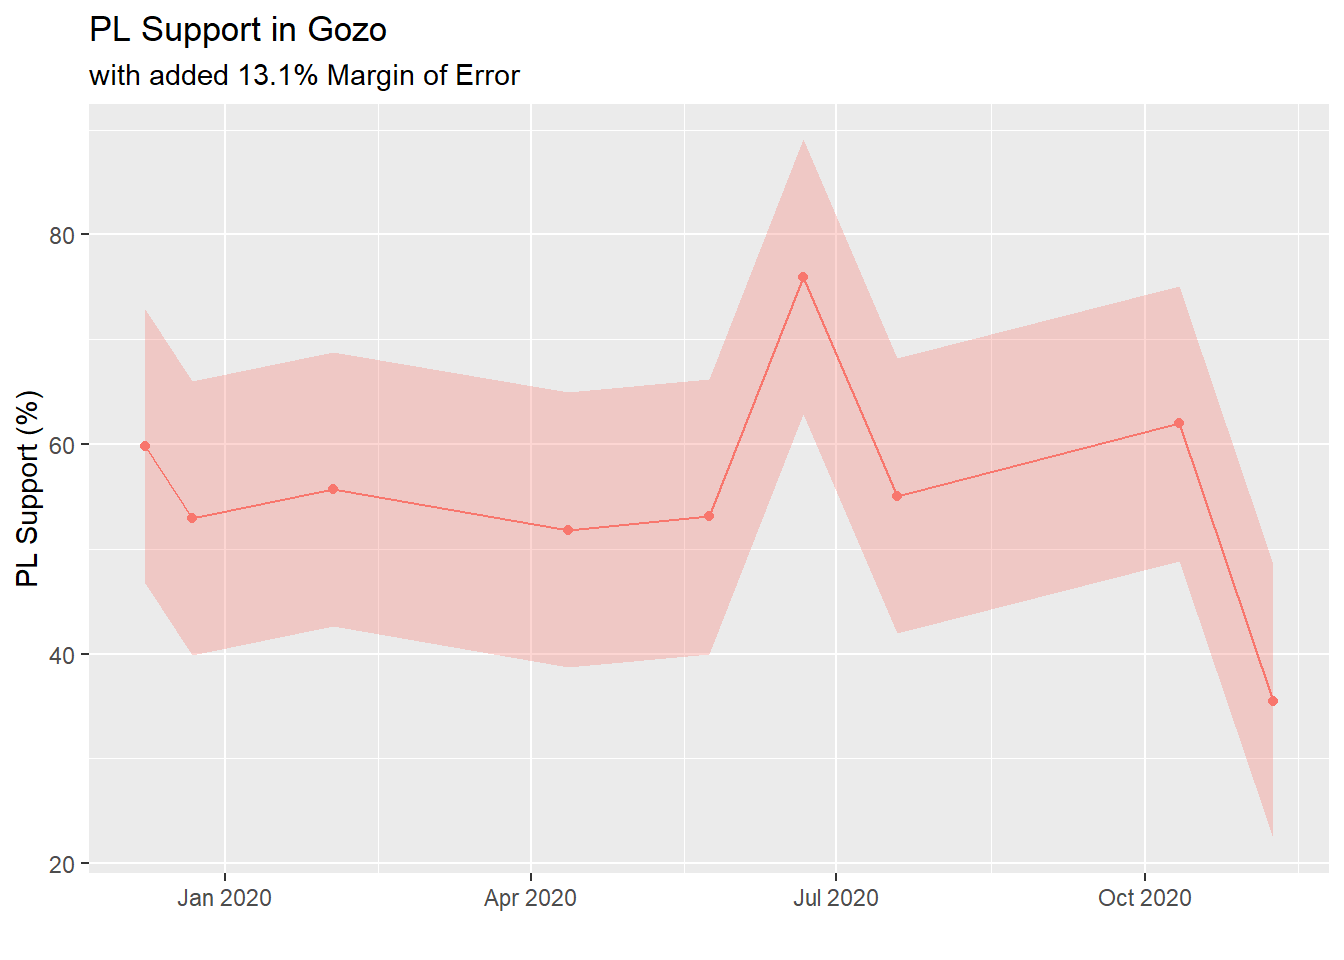
## 49.30468upper - lower## 97.5%
## 13.09118…leaving us with an estimate of PL support in Gozo between 62.4% and 49.3%, resulting in a 13.1% margin of error. The supposed shift also motivated Vincent Marmara do carry out his own survey of Gozo with 500 Gozitans sampled, in early November. Unsurprisingly, his number (this time with a MOE of 4%) showed a PL support at around 52.8%.
Plotting all of this additional information to the above leaves us with something like this.
GozoBootstrap+
  #lower
  geom_vline(aes(xintercept = quantile(sims, 0.025)), lty = "dashed", col = "blue")+
  #upper
  geom_vline(aes(xintercept = quantile(sims, 0.975)), lty = "dashed", col = "blue")+
  #Marmara Survey where Gozo n = 500
  geom_vline((aes(xintercept = (100/98.7)*52.8)), size = 2, col = "red" )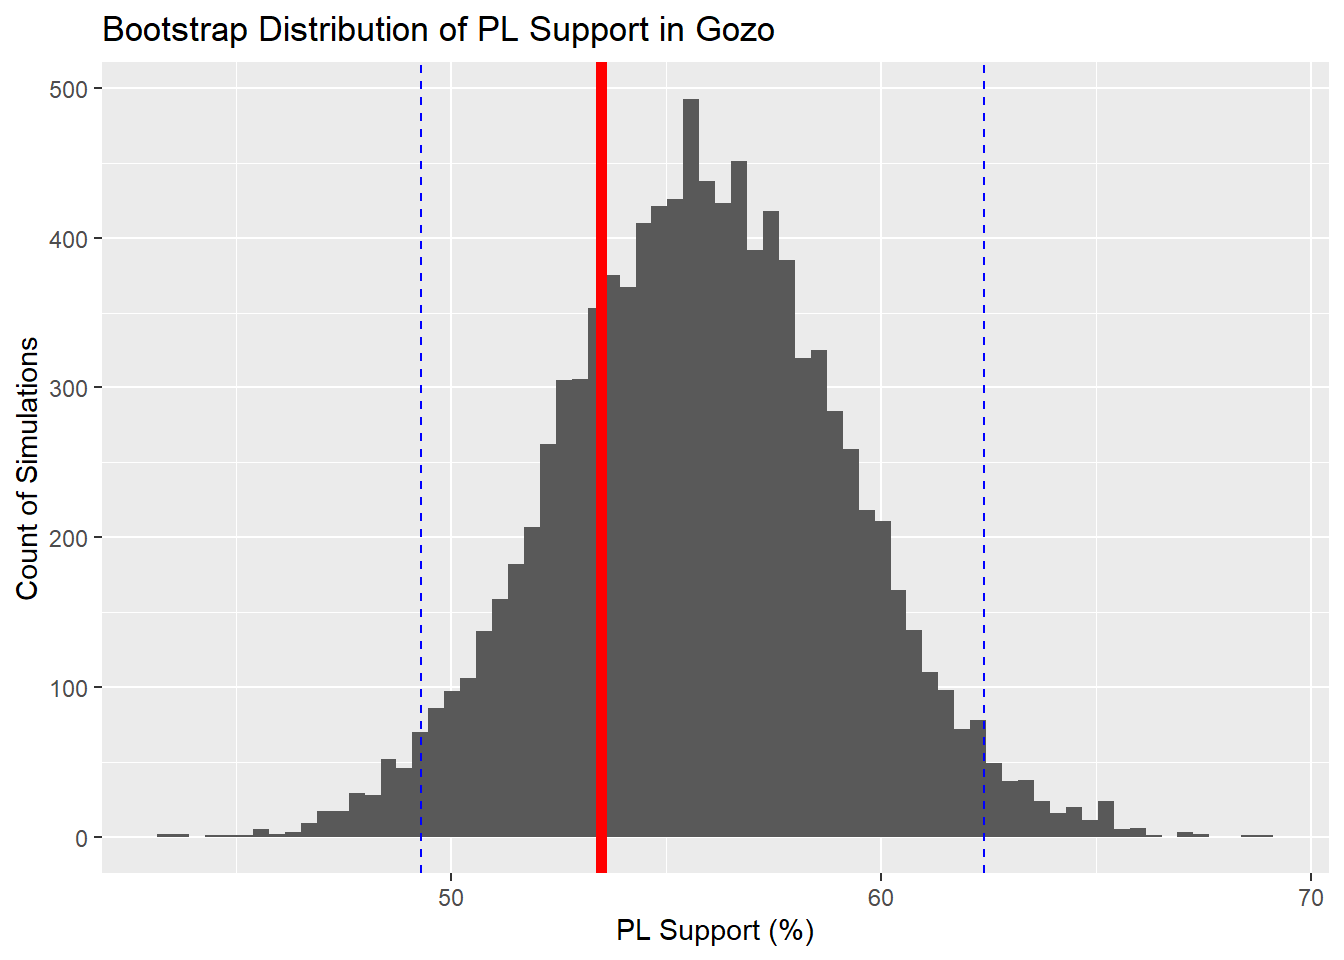
Now that we have a decent estimate for a confidence margin, we can add it to the plot to get an idea of the grain of sand you should take subgroups with.