I had given donkey voting an exhaustive treatment here, but Mark Anthony Sammut brought it back to light in this video. His argument for the presence of Donkey voting is essentially the lack of a uniform distribution of MP’s surnames across all the letters of the alphabet (given there are 30 Maltese letters, and 67 seats, you would expect each letter to have 2.2 seats).
This distribution would make sense if surnames are evenly distributed across the alphabet… but it almost certainly isn’t. However, Sammut’s post did get my attention at a perhaps more elegant way to look at donkey voting by:
- Establish the distribution of Maltese surnames across the alphabet.
- Establish the distribution of surnames in parliament.
- Compare both!
Finding data for 1 was difficult, so I relented and spent a few hours of the weekend trawling a few popular social network pages and manually copying and pasting the occurrence of surnames into excel. In theory, it should approximate the distribution of surnames in the general population.
For 2 I used the John C. Lane/UoM Parliamentary Election Dataset filtered for the years 1986-2013 also introduced in the previous donkey voting post.
What Surnames in Parliament are over/under-represented vs. the Population?
By subtracting the proportion of say Abelas in the general population (3%) from Abelas in Parliament (1.1% of all members) we can deduce that Abelas are under-represented. In the same vein, a negative difference (0.5% of the population are Camilleris, vs 2.7% in Parliament) would show that Camilleri is overrepresented in Parliament.
Here’s how the surnames of MP’s across 2013-1986 stacked up:
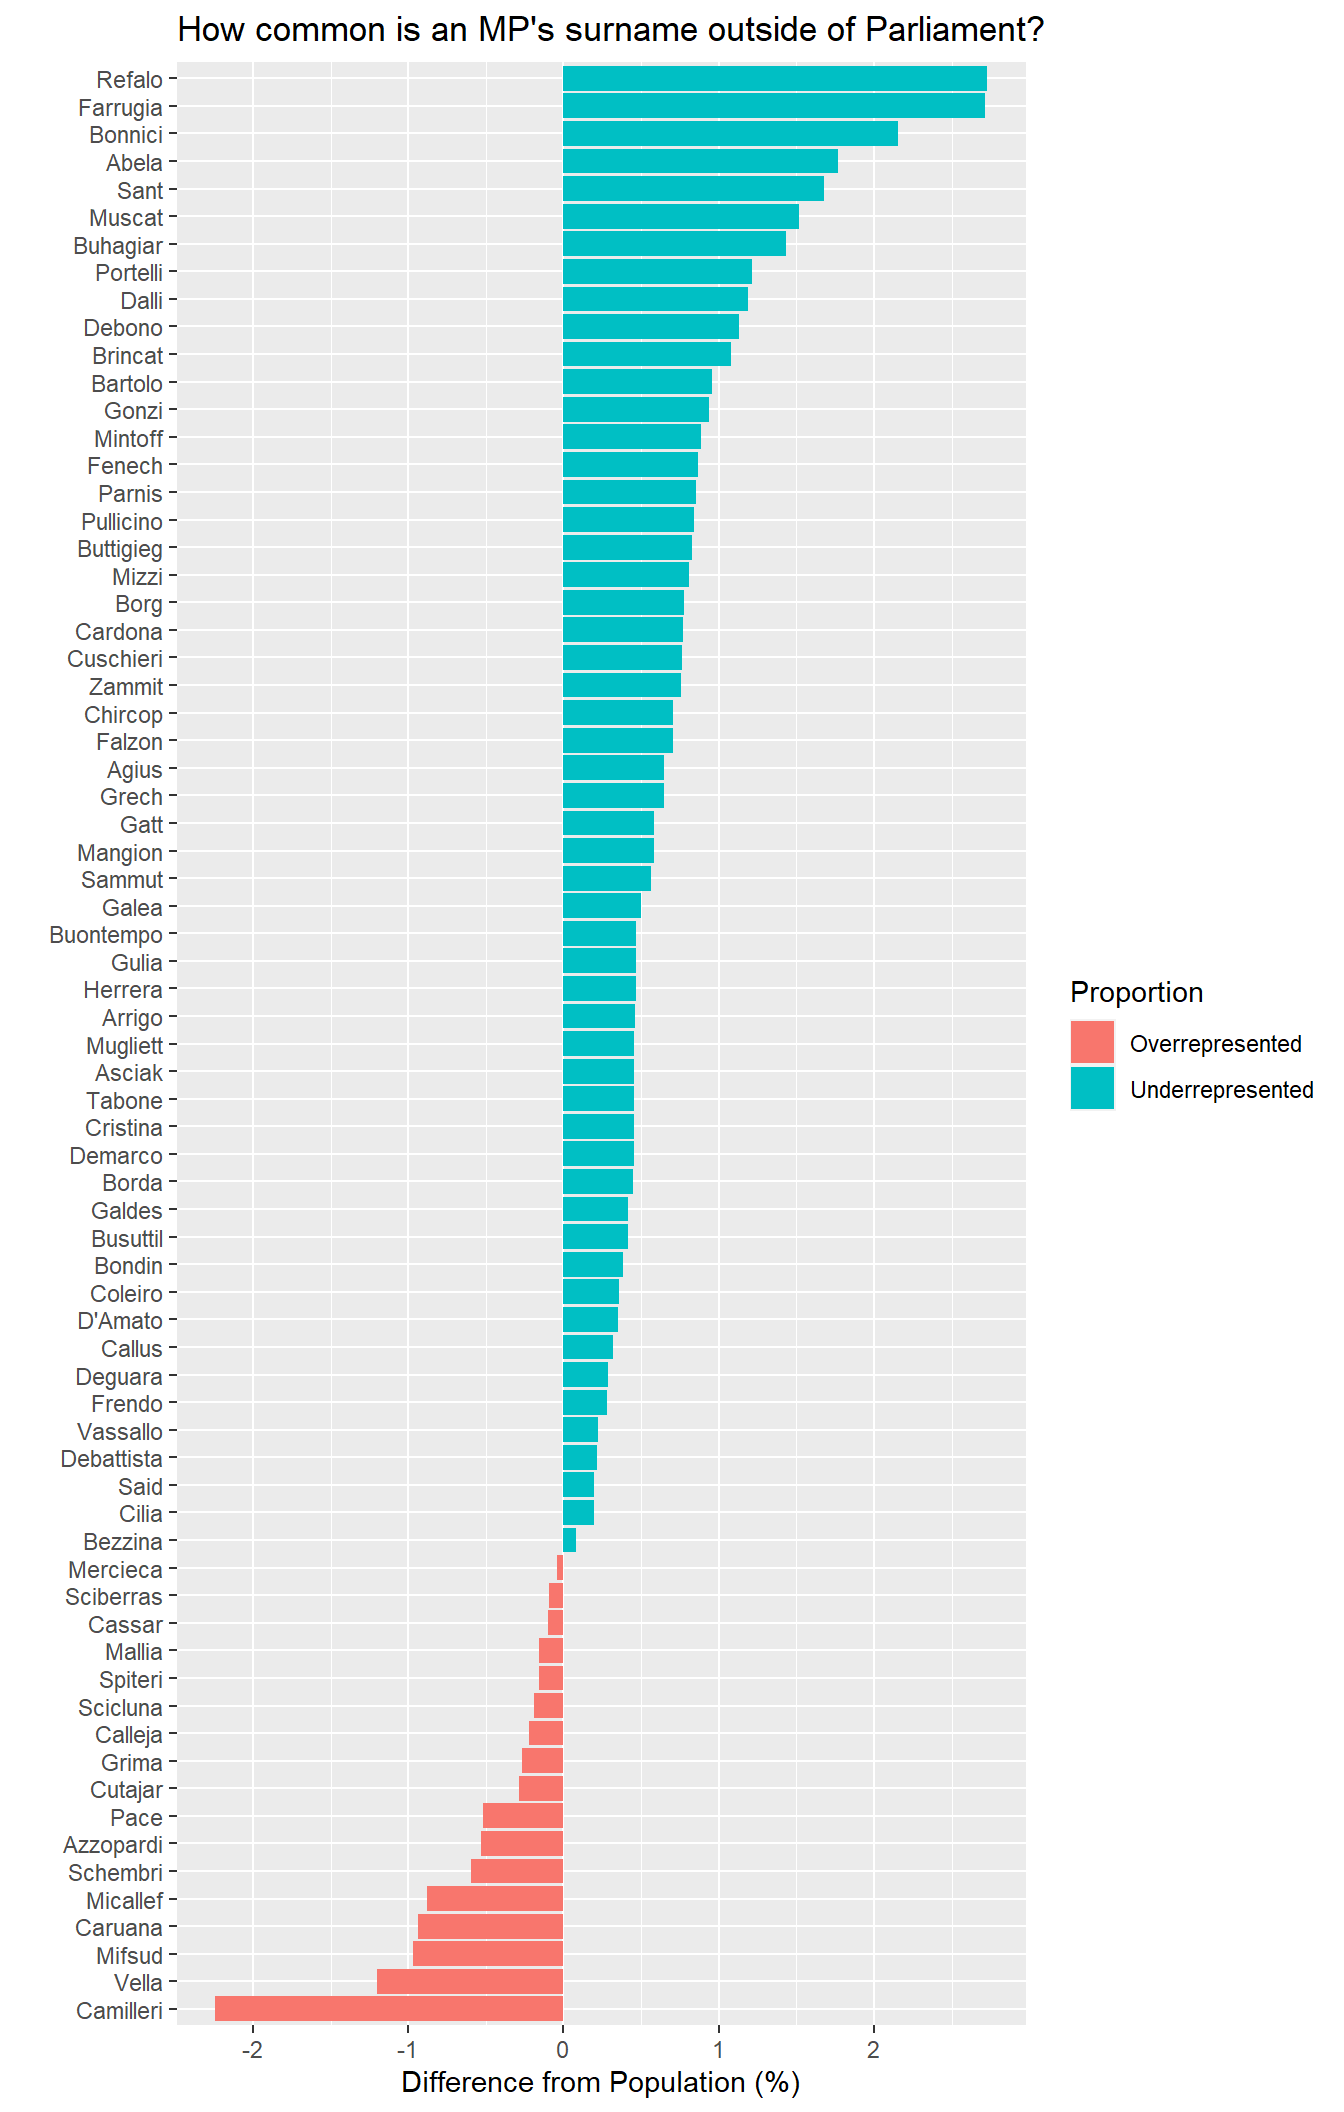
While the above graph shows pretty clearly that some surnames are over represented or under represented irrespective of the initial letter, it’s still only counting those who made it to Parliament (i.e. endured the supposed bias).
We can go one step further. I extracted the initial letter from the surname and counted the proportion of people with those surnames as a percentage to all surnames observed.
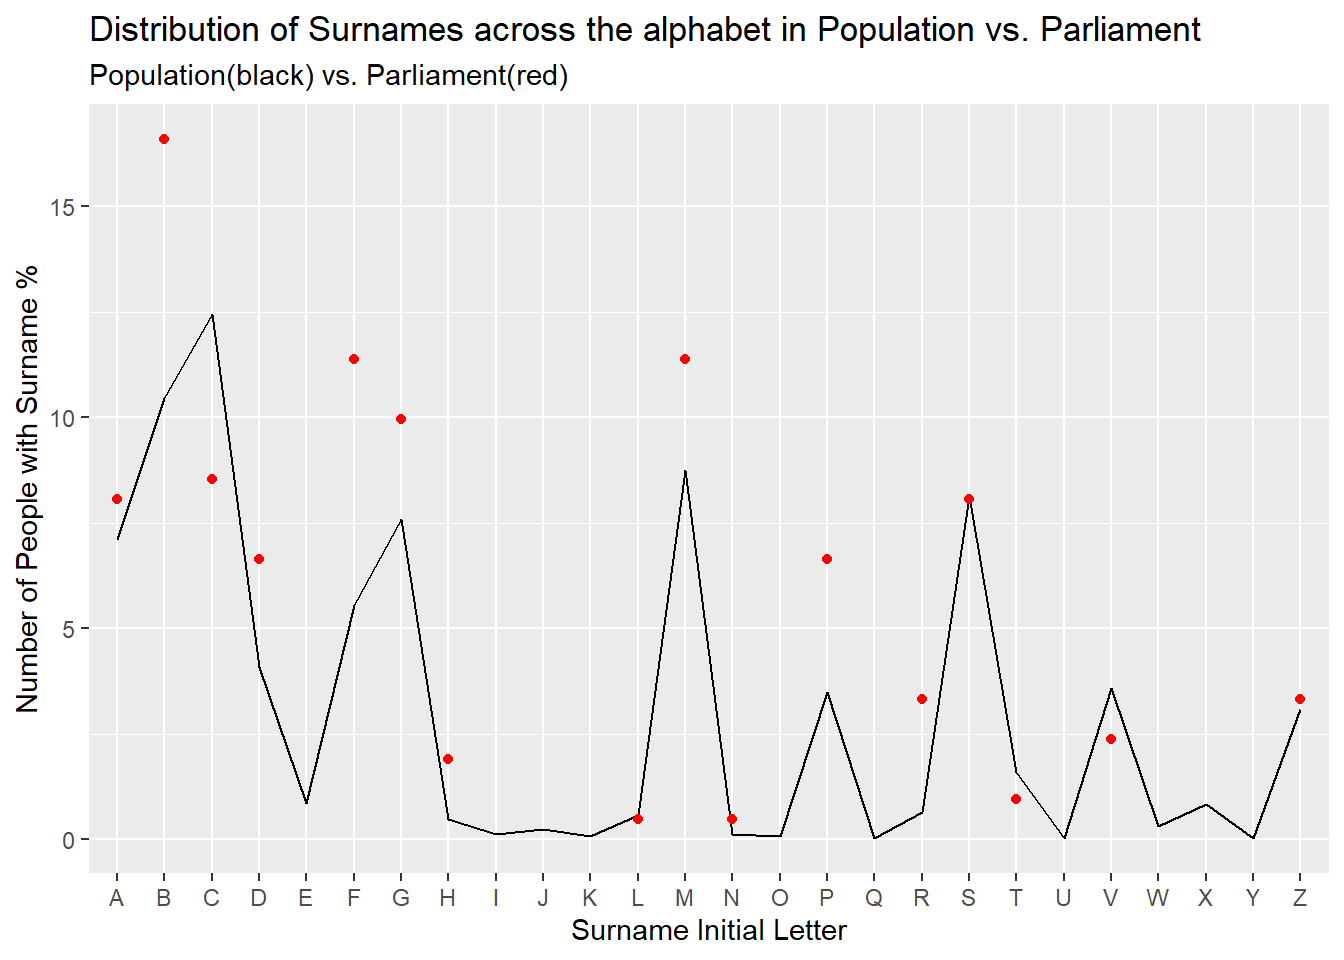
If the donkey vote hypothesis is correct, letters where the red Parliamentary dot is above the black population line would be in the first few positions. But the letters that are overrepresented span the alphabet (B, F, G, M, P, R), A is nearly equivalent to the prevalence in the population, and C is actually underrepresented in Parliament compared to the general population.
Conclusion: Déjà vu
Donkey voting seems to be another item in that assorted list of “common facts” that never stands up to scrutiny. Was someone elected to Parliament because of his surname order? Probably. But that doesn’t mean it’s a systemic problem. Donkey voting by defenition starts to take effect after the first few deliberate choices, and in districts where 2-3 MP’s on each party ballot get elected, blaming it for not getting elected is splitting at hairs.