The Literary Utopia on Paris’ Left Bank
Shakespeare and Company is as legendary as bookshops get. Owner Sylvia Beach was the publisher of “Ulysses”, written by one of her patrons, James Joyce. Besides Joyce, had you visited, you might also have of run into other literary giants like Ezra Pound, F. Scott Fitzgerald, Gertrude Stein and Ernest Hemingway.
Hemingway was so fond of the shop on rue de l’Odéon in Paris’s 6th arrondissement that he visited it with militiamen during the liberation of Paris to ensure its freedom. And as odd as it might seem that the center of the great English literary movement of the inter-war period was Paris, this bookshop must have of played a part.
You see, the lost generation wandering Paris in those roaring twenties was hard pressed for English bookshops. And in this desert, Sylvia Beach became their oasis, crosspollenating literary ideas.
Princeton has released Shakespeare and Company’s lending logbook and membership cards in an ambitious project to document this period in literary history.
The records have been compiled into three datasets. Members contains biographical details of 5,700 members who held lending library cards. The books table has roughly 6,000 titles that were in the store’s collection. But the bread and butter of this analysis will be “Events”, a reconstruction of Beach’s logbook into upwards of 33,000 events detailing which member did what action on which book on what date.
How Active was it?
So, just how active was the bookshop? One way we can examine this is to plot the total number of events recorded in the logbook per year. For this I chose four event types:
Purchase (of a book).
Subscription (to the lending library)
Renewal (of the lending library subscription)
Borrow (a book from the lending library)
The terms of borrowing are fully outlined in the Princeton resource website, but in a nutshell:
For eight francs plus a seven franc deposit, you can join for a month and borrow one book at a time. For twelve francs and a fourteen franc deposit, you can borrow two books at a time. You are allowed to keep older books for up to two weeks, recent books for one. You’ll be fined ten centime-a-day for overdue books.
events %>%
  group_by(year(start_date), event_type) %>%
  tally() %>%
  filter(event_type %in% c("Borrow", "Purchase", "Renewal", "Subscription")) %>%
  ggplot(aes(`year(start_date)`, n, col = event_type))+
  geom_line()+
  labs(col = "Event Type",
       title = "Number of Shakespeare & Co. Events")+
  ylab("Events")+
  xlab("Year")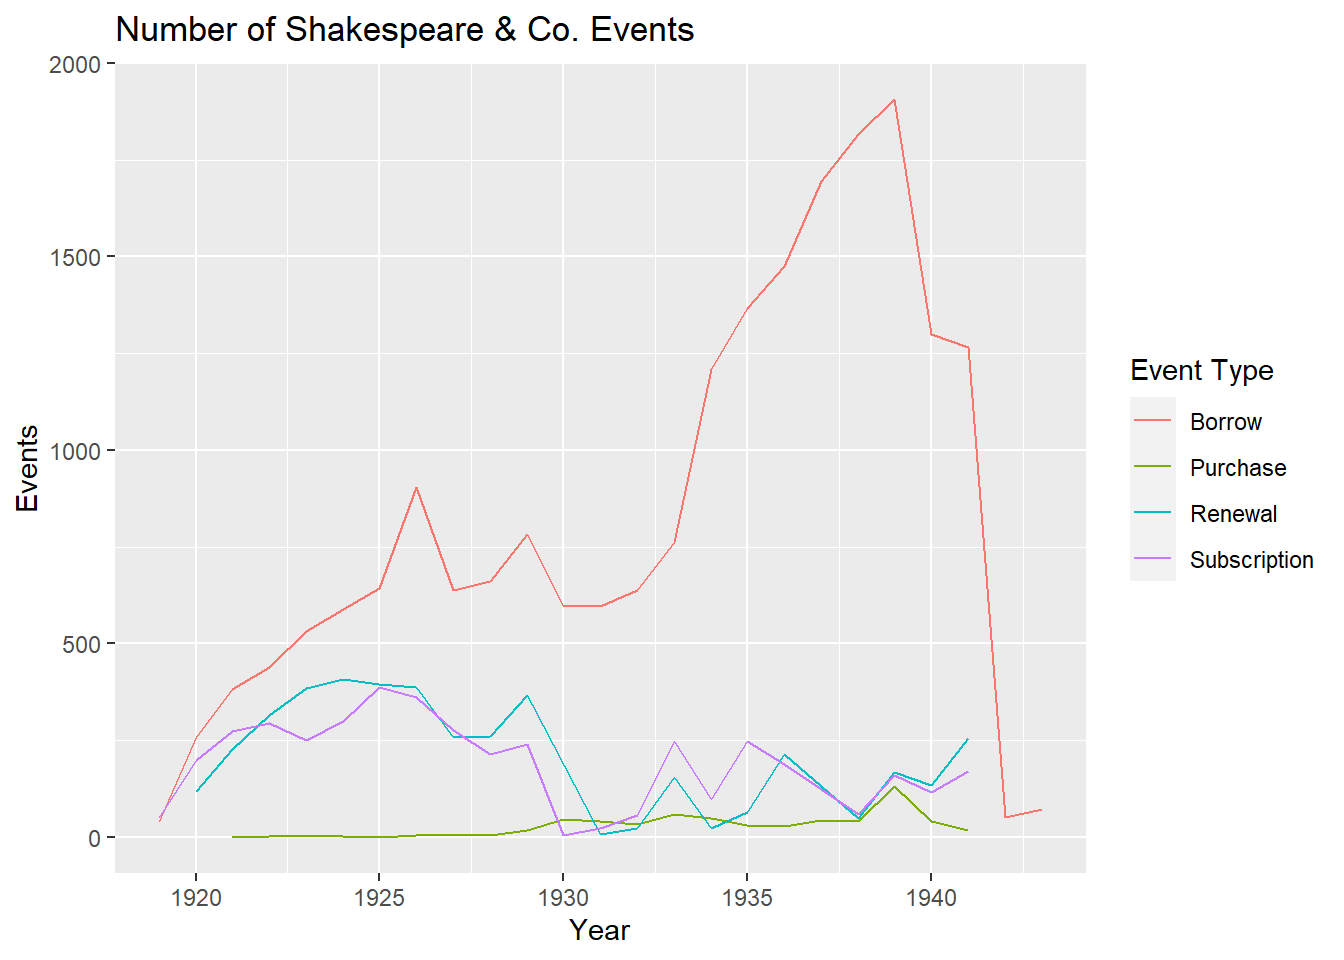
There seemed to be a steady stream of 300-400 renewals and subscriptions each in the 1920-1930 period, while the lending library’s borrowing activity reached its peak later in the 1930’s. I should point out that not all of the logbooks have been recovered, and there are some gaps in the data (the drops in 1931 and 1932 are an example of this.) More on this here.
Actual purchases of books seem to be less common. Since the lending library aspect seems to be the most popular, let’s focus on that for now. One interesting takeaway we could come up with is to see if book borrowing exhibits a seasonal component.
To do this, I filtered only borrowing events and created a heatmap of lending split by year and month. The colour gradient of the fill corresponds to the weighted activity that month had in a given year. For instance, if January 1920 had 10 events, and the entirety of 1920 had 100 borrowing events, January would have a 10% share (10/100).
As you might expect, borrowing does seem to be down in the summer, notably August and September, and up in winter (November-January). July 1941 seems to have of been an outlier because of the occupation of Paris: it wasn’t that they were borrowing a great deal in the summer, they just didn’t borrow much through the year.
events %>%
  filter(event_type == "Borrow") %>%
  mutate(year = year(start_date), month = month(start_date, label = T)) %>%
  group_by(year, month) %>%
  tally() %>%
  group_by(year) %>%
  mutate(yearly = sum(n), n_scaled = n/yearly*100) %>%
  filter(year > 1919) %>% #we only have 2 months in 1919.
ggplot(aes(x = year, y = reorder(month, desc(month)), fill= n_scaled)) +
  geom_tile() +
  scale_fill_gradient(low="white", high="blue")+
  labs(fill = "Borrowings",
       title = "Does Borrowing Have a Strong Seasonality?",
       subtitle = "Scale is month's % as a proportion of that whole year.")+
  xlab("Year")+
  ylab("Month")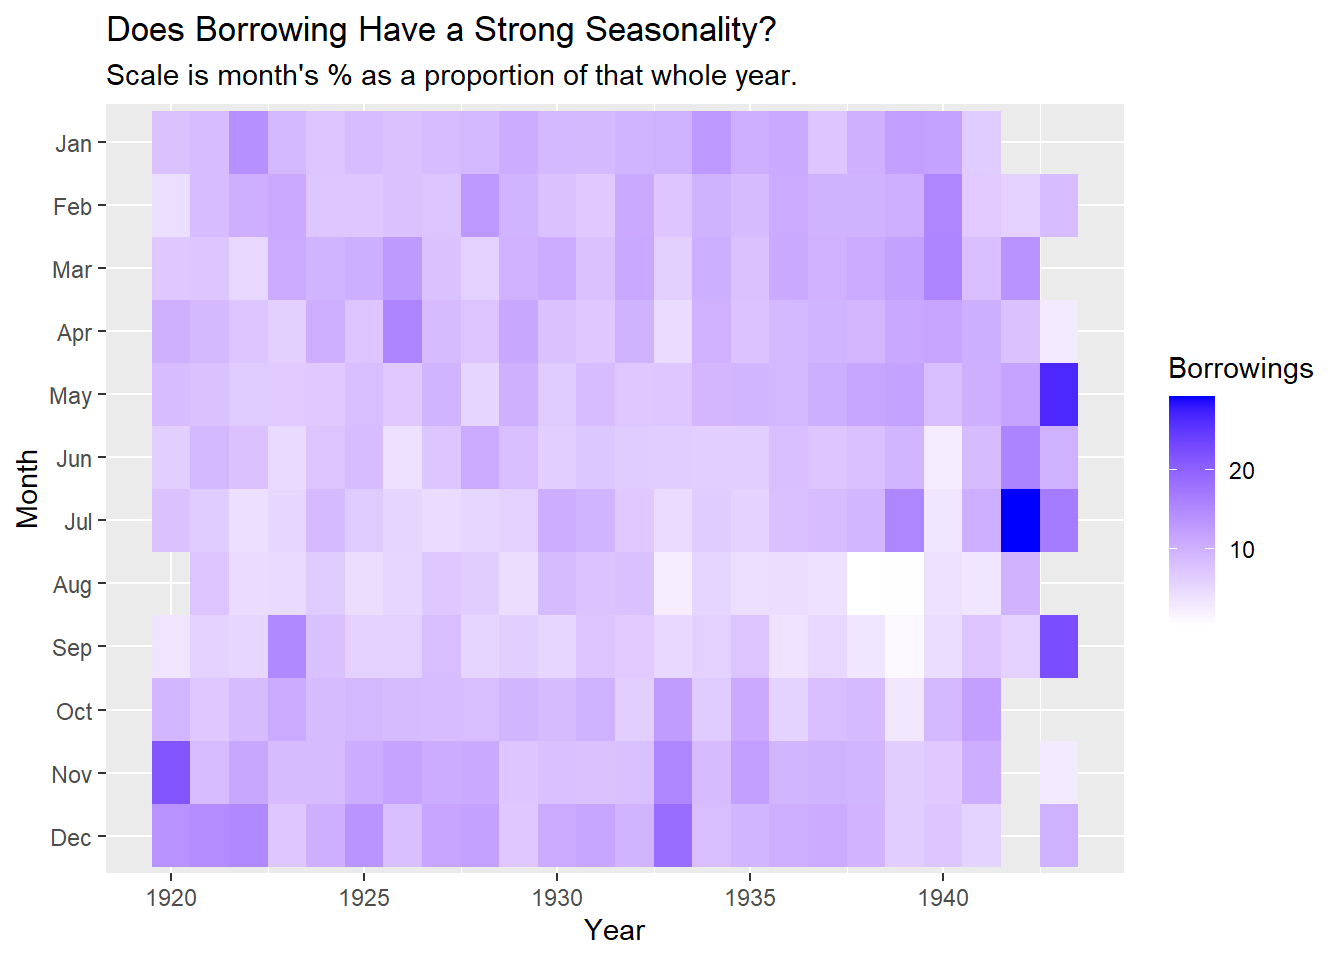
How Profitable is it?
Included in the logs are the fees each member paid. From the blurb on how membership worked, the deposit was returned at the end of a membership, so I settled for visualising both these components over time in an area graph format.
financials <- events %>%
  group_by(year(start_date)) %>%
  summarise(Subscriptions = sum(subscription_price_paid, na.rm = T),
            Deposits = sum(subscription_deposit, na.rm = T)) %>%
  gather(key = "Component", value = "Francs", -`year(start_date)`) %>%
  filter(`year(start_date)` <= 1945)

ggplot(financials, aes(x = `year(start_date)`, y = Francs, fill = Component))+
  geom_area(alpha = 0.8)+
  labs(title = "Yearly Subscriptions & Deposits")+
  xlab("Year")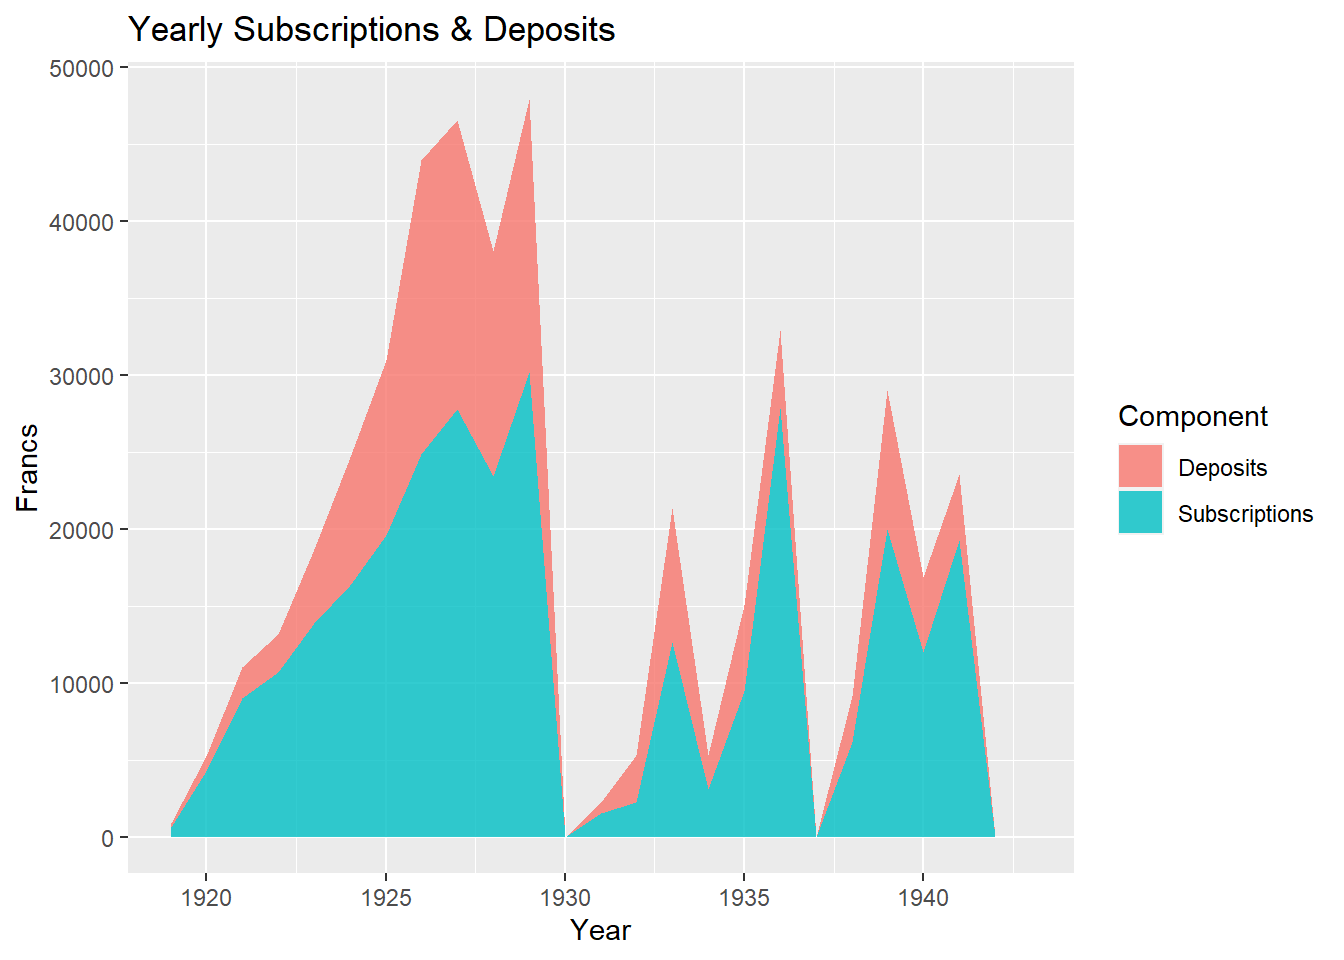
Shakespeare & Co. could count on a healthy income from subscriptions of around 20,000 to 25,000 francs in the later half of the 1920’s, and around 11,000 to 18,000 francs of deposits. Trying to convert this figure to a modern-day equivalent proved more nuanced than I assumed because of considerations like relative wealth vs. absolute wealth, but as a gross simplification, I used this resource based off research by the Central Bank of Sweden. 25,000 francs in 1925 according to them is worth the following in 2015 Euros:
12,782 Euros of consumer goods and services (absolute worth).
A wage for 3950 hours of work. The equivalent 2015 salary in Sweden was 88,322 Euros (relative worth).
Membership Lifetime
Although owning an independent bookstore in 1920’s Paris might seem like an alien world to modern day corporate culture, Sylvia Beach did put in place the darling of modern business before it was even a twinkle in the eyes of most corporations: subscription models.
The median lifetime (red dashed line) is 61 days, or two months. Or, to put it another way, half the members only stayed around for a month or two. The other half distribute along a long tail, in a manner like what you’d see in modern business data: a handful of customers give you a lot of business.
Interestingly, two peaks also occur at the 180 day and 365 day mark. Whether people have a preference for neat times or if this is a case of prepaid 6 month and 1 year memberships lapsing, I’m uncertain.
lifetime <- events %>%
  filter(event_type %in% c("Renewal", "Subscription")) %>%
  group_by(member_names) %>%
  summarise(total_duration = sum(subscription_duration_days, na.rm=T))

  ggplot(lifetime, aes(total_duration)) +
  geom_histogram(bins = 50) +
  geom_vline(xintercept = median(lifetime$total_duration), linetype="dashed", color = "red")+
  xlim(0, 1000)+
  labs(title = "What's the lifetime of Shakespeare & Co. Members?")+
  ylab("Number of Members")+
  xlab("Duration in Days")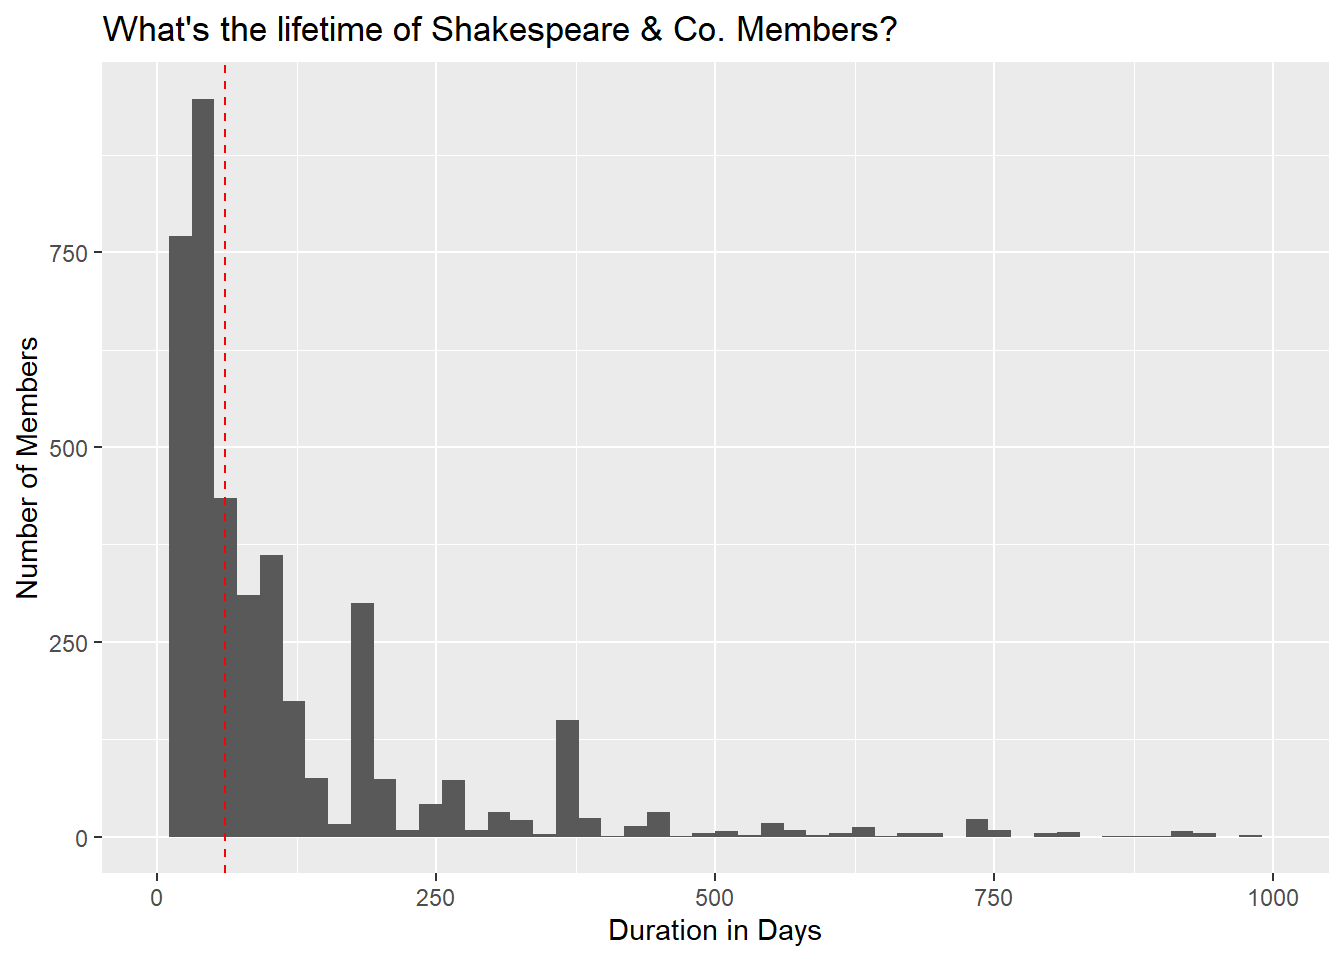
Members who Borrowed the same Books
Given the structure of the events table, we can come up with a list of which members borrowed what books. Organizing data in this way naturally lends itself to network analysis. To do this I selected the member names and books associated with each event, and used widyr’s pairwise_count() function to come up with a count of items (members) across the same feature (books).
We can then come up with the below graph, showing the literary similarities between the most prolific borrowers. The strength of the line indicates more similar reading lists: Francoise de Marcilly, Fernand Colens and Mr. Morgan read many the same books. Barbara Church’s interests were more niche and aligned with D.S.S Mackenzie and Jeanine Teissier.
I should note that I filtered out the two most prolific readers in the dataset: Alice M. Killen and Mme France Raphael. They borrowed upwards of 500 books each, and swayed the network.
membergraph <- borrowings %>%
  filter(!member_names %in% c("Alice M. Killen", "Mme France Raphael")) %>%
  select(member_names, item_title) %>%
  pairwise_count(member_names, item_title, upper = FALSE)

set.seed(42)
membergraph %>%
  filter(n >= 22) %>%
  graph_from_data_frame() %>%
  ggraph(layout = "linear",
         circular = T) +
  geom_edge_arc(aes(alpha = n,
                    edge_width = n,
                    color = "#CE3E3E"))+
  geom_node_point(size = 4,
                  color = "grey40") +
  geom_node_text(aes(label = name),
                 check_overlap = T,
                 repel = T,
                 size = 4,
                 color = "black") +
  theme_void()+
  theme(plot.background = element_rect(fill = "white"),
        legend.position="none",
        plot.title = element_text(size = 12,
                                  color = "black",
                                  face = "bold")) +
  labs(title = "  Members Who Borrowed the Same Books")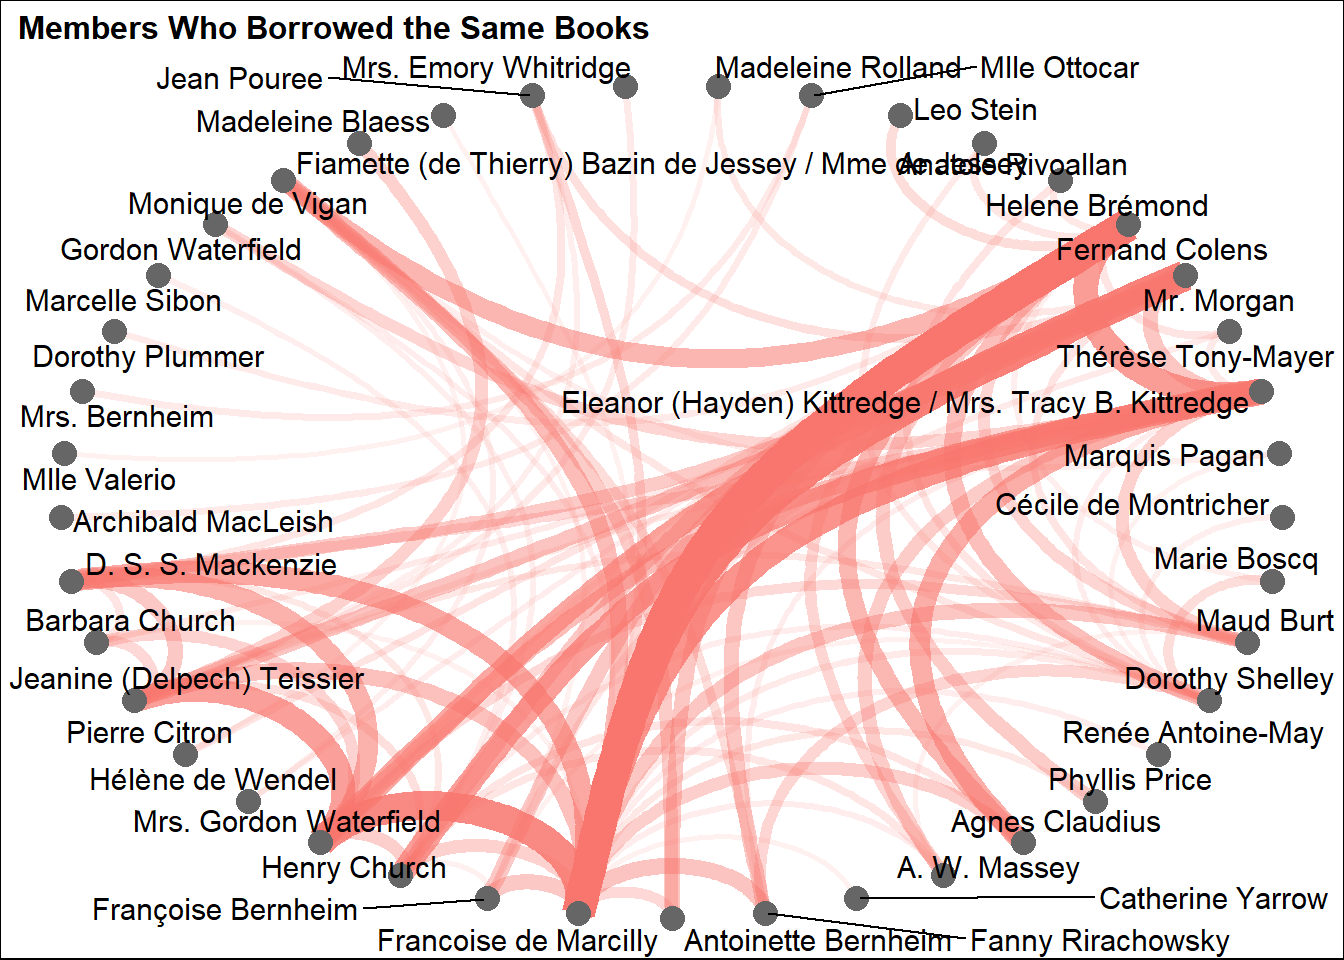
Books read by the same people
We can just as easily apply the same concept to the books. As you’d expect with a bookstore whose owner published Ulysses, there’s a pronounced James Joyce cluster, with many of the same people borrowing Dubliners, Exiles and A Portrait of the Artist as a Young Man. Ulysses itself was not that popular of a borrowing choice, I assume because Beach probably sold them.
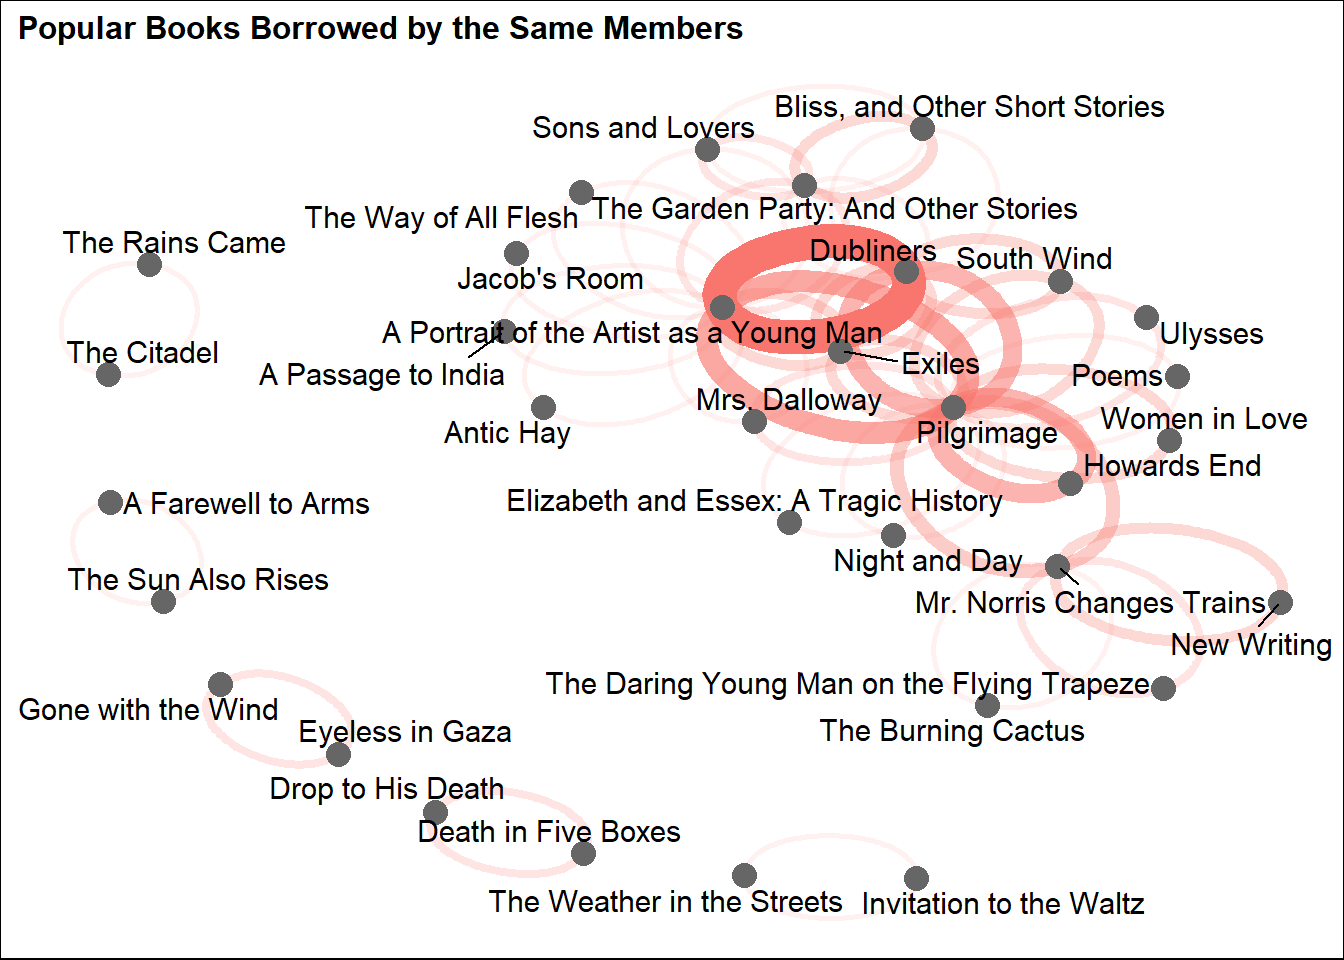
Pilgramage is Dorothy Richardson’s novel sequence from 1915, and at the time popular and influential in modernist circles, so its presence in the main cluster is also intuitive. Howards End by E. M. Forster and D.H. Lawrence’s Women in Love also unsurprisingly make a buzz.
There are also two other author centric clusters, one for Hemingway (The Sun Also Rises and A Farewell to Arms), and one for John Dickson Carr (Drop to His Death, Death in Five Boxes).
More interesting are the odder pairings: Louis Bromfield’s The Rains Came and A. J. Cronin’s The Citadel seem to have enjoyed a peculiar synergy, as did Gone with the Wind and Eyeless in Gaza.
Take Two: Famous People who Borrowed the Same Books
The members table has a column linking to a Wikipedia article of the person if found, so I thought we might leverage this to our advantage and recreate the first network but for “famous” people – famous in this context means having a Wikipedia page.
I created a vector of members whose Wikipedia link column is not null, and used it to filter the events table for only these members. The rest is just merely recycling the previous code.
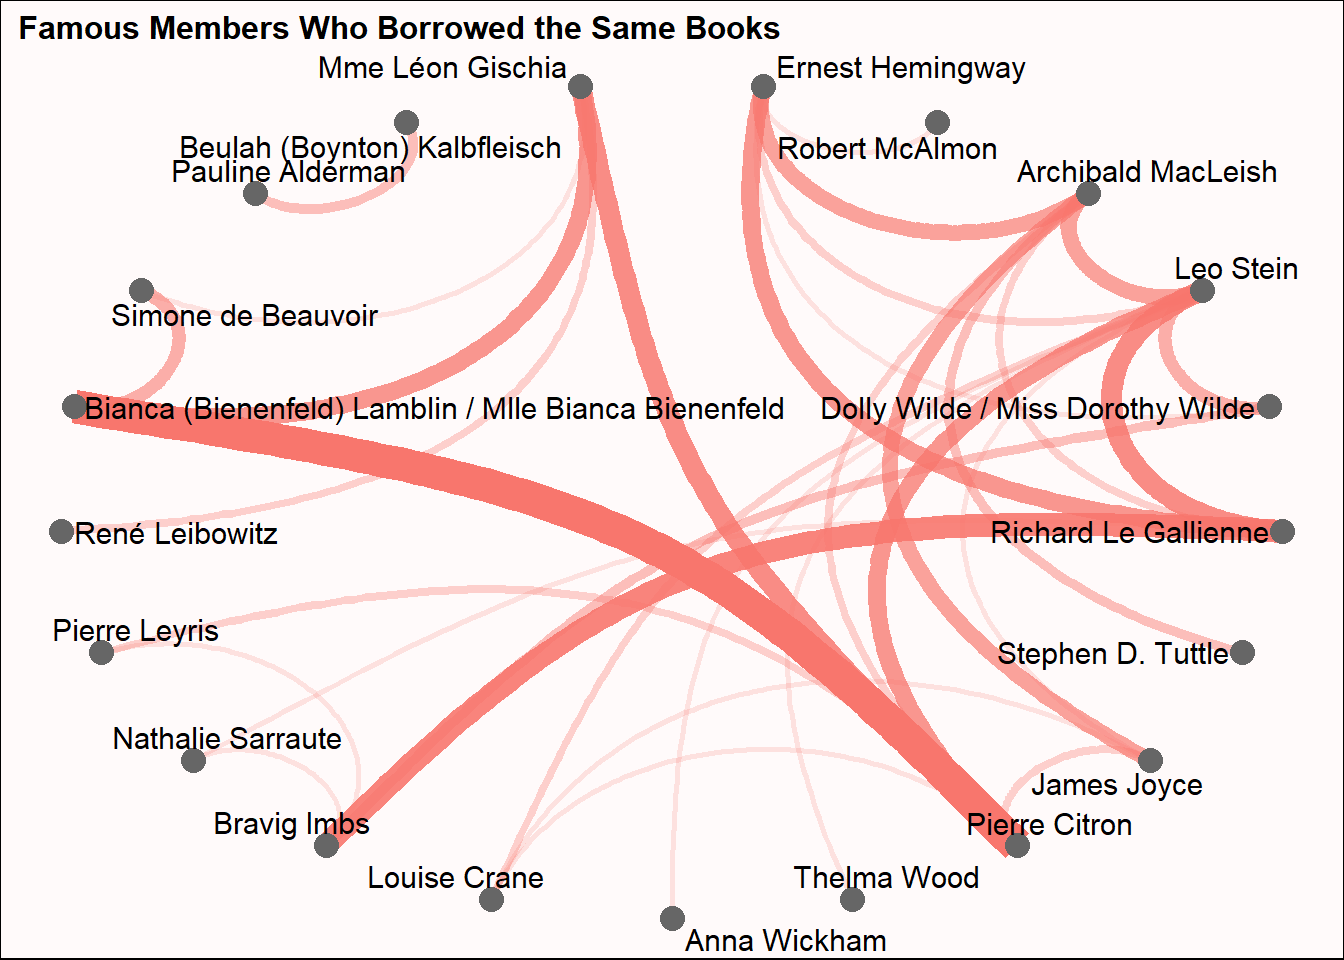
In theory you should find all these members on Wikipedia. The strongest link in reading lists seems to be between French musicologist Pierre Citron and Bianca Bienenfeld, while American poet and Pulitzer Prize winner Archibald MacLeish shares the distinction of having the most Joycean reading list.
Where did Shakespeare and Company’s members live?
One of the fields Sylvia Beach meticulously logged was her members’ addresses. The Princeton team reverse geo tagged around 1,500 of these with latitude and longitude coordinates, allowing us to plot maps like the below.
Since this is a map about Parisian book readers, I thought it would be fitting to plot these on Stamen’s fiction invoking watercolours basemap, which is fantastic for whimsical topics like these.
leaflet() %>%
  setView(lng = 2.352, lat = 48.856614, zoom = 12) %>%
  addProviderTiles(providers$Stamen.Watercolor) %>%
  addCircleMarkers(data = members, popup = ~name,
                   stroke = FALSE, fillOpacity = 0.5,
                   radius = 5) %>%
  addMarkers(lng=2.3362597, lat=48.8509186, popup="Shakespeare & Company")
As for this map of ghost dots, it’s as strong a legacy for Sylvia Beach as her publishing Ulysses. She fed all souls literature across this dispersed tapestry and nurtured some anew.
P.S. If I’ve piqued your interest in the period, this is excellent reading.
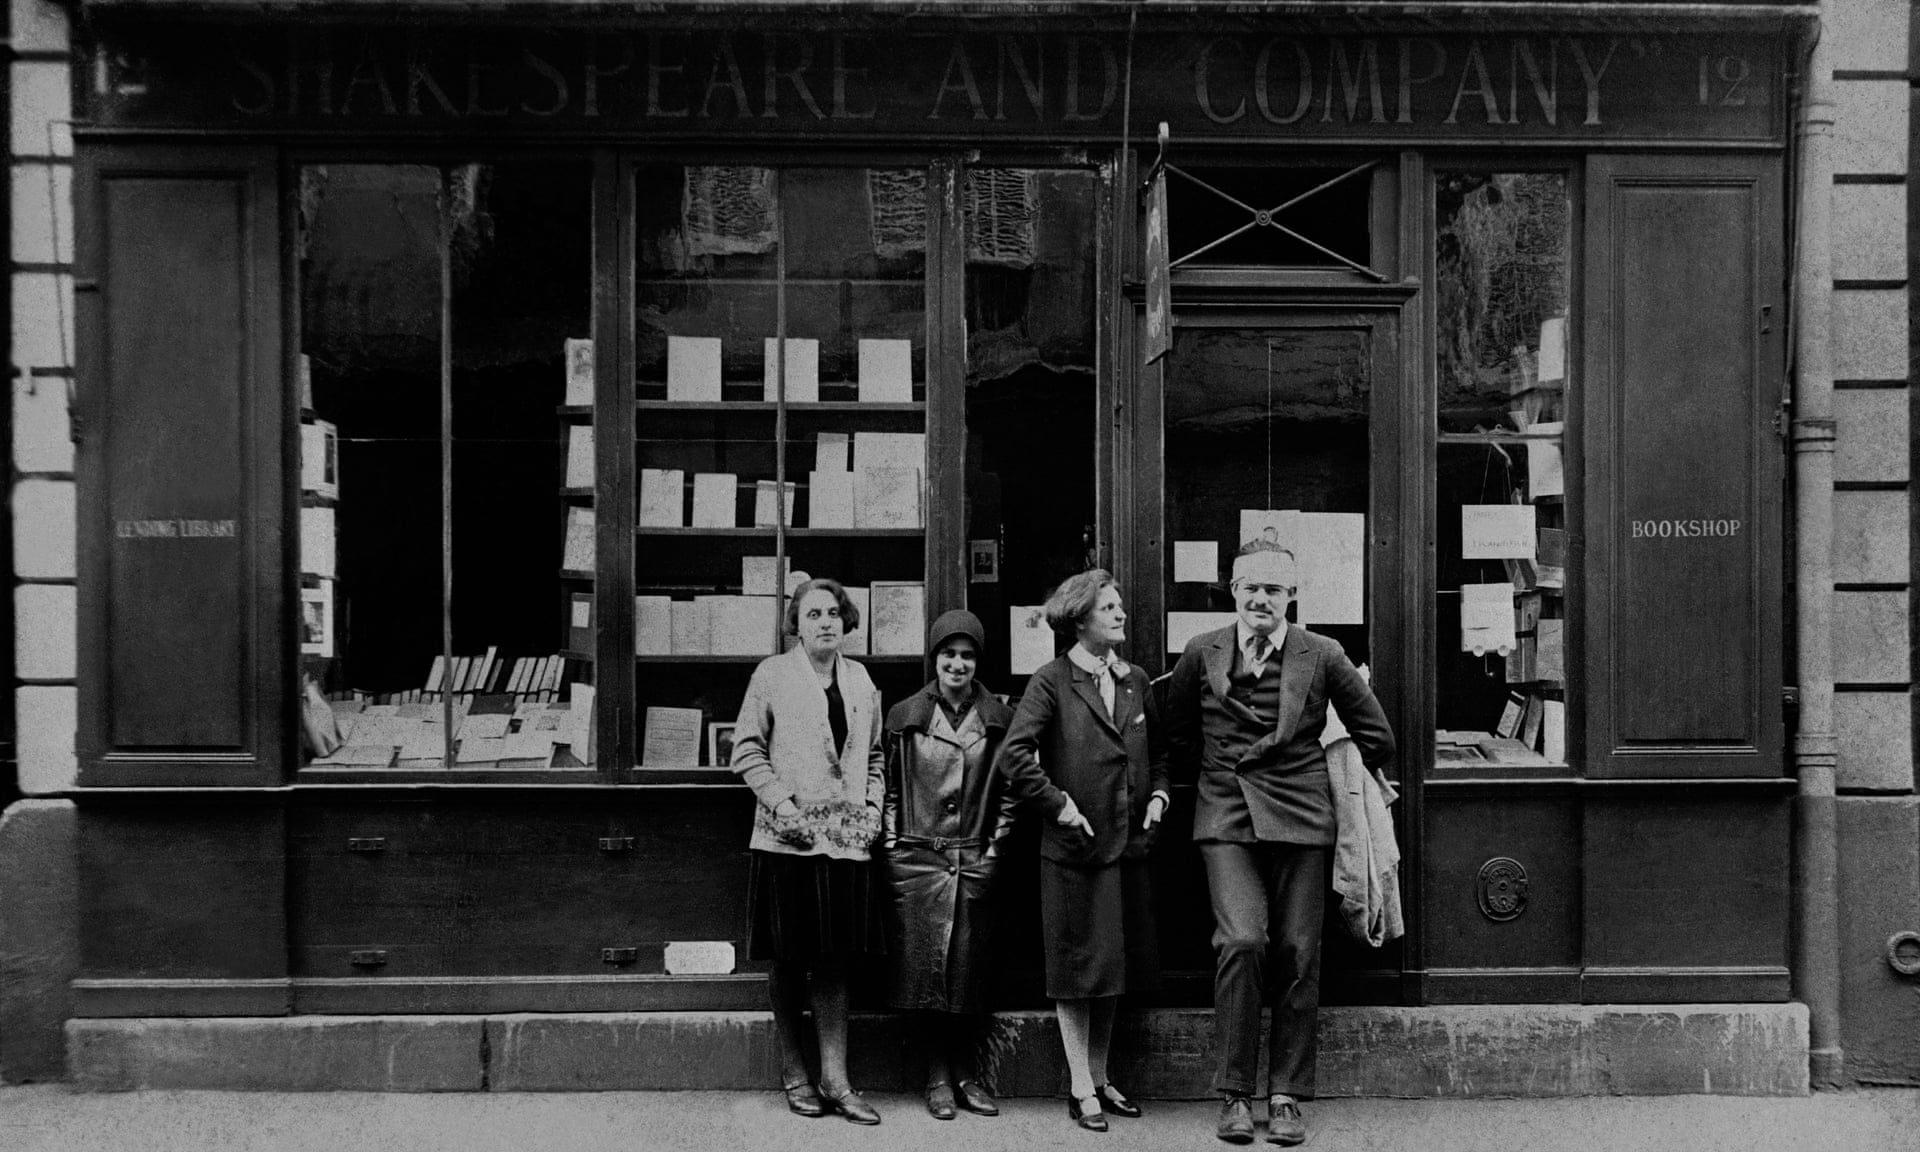
Hemingway (right) with Sylvia Beach (third from left) and two others outside Shakespeare and Company in 1926. From the Guardian.